Key question: “Can we integrate safely every day?”
This phase establishes the development practices that make continuous delivery possible.
Without these foundations, pipeline automation just speeds up a broken process.
Everything as code - Version-control everything that defines your system: infrastructure, pipelines, schemas, monitoring, and security policies
Why This Phase Matters
Teams that skip these foundations end up automating a broken process. A pipeline that deploys untested code from long-lived branches does not improve delivery. It amplifies risk. These practices ensure that what enters the pipeline is already safe to ship.
When You’re Ready to Move On
Start investing in Phase 2: Pipeline when you are making
consistent progress toward these - don’t wait for every criterion to be perfect:
All developers integrate to trunk at least once per day
Your test suite catches real defects and runs in under 10 minutes
You can build and package your application with a single command
Most work items can be completed within 2 days
Next:Phase 2 - Pipeline - build a single automated path from commit to production.
Related Content
Phase 0: Assess - The assessment phase that precedes Foundations
Integrate all work to the trunk at least once per day to enable continuous integration.
Phase 1 - Foundations | Scope: Team
Trunk-based development is the first foundation to establish. Without daily integration to a shared trunk, the rest of the CD migration cannot succeed. This page covers the core practice, two migration paths, and a tactical guide for getting started.
What Is Trunk-Based Development?
Trunk-based development (TBD) is a branching strategy where all developers integrate their work into a single shared branch - the trunk - at least once per day. The trunk is always kept in a releasable state.
This is a non-negotiable prerequisite for continuous delivery. If your team is not integrating to trunk daily, you are not doing CI, and you cannot do CD. There is no workaround.
“If it hurts, do it more often, and bring the pain forward.”
Jez Humble, Continuous Delivery
What TBD Is Not
It is not “everyone commits directly to main with no guardrails.” You still test, review, and validate work - you just do it in small increments.
It is not incompatible with code review. It requires review to happen quickly.
It is not reckless. It is the opposite: small, frequent integrations are far safer than large, infrequent merges.
What Trunk-Based Development Improves
Problem
How TBD Helps
Merge conflicts
Small changes integrated frequently rarely conflict
Integration risk
Bugs are caught within hours, not weeks
Long-lived branches diverge from reality
The trunk always reflects the current state of the codebase
“Works on my branch” syndrome
Everyone shares the same integration point
Slow feedback
CI runs on every integration, giving immediate signal
There are two valid approaches to trunk-based development. Both satisfy the minimum CD requirement of daily integration. Choose the one that fits your team’s current maturity and constraints.
Path 1: Short-Lived Branches
Developers create branches that live for less than 24 hours. Work is done on the branch, reviewed quickly, and merged to trunk within a single day.
How it works:
Pull the latest trunk
Create a short-lived branch
Make small, focused changes
Open a pull request (or use pair programming as the review)
Merge to trunk before end of day
The branch is deleted after merge
Best for teams that:
Currently use long-lived feature branches and need a stepping stone
Have regulatory requirements for traceable review records
Use pull request workflows they want to keep (but make faster)
Are new to TBD and want a gradual transition
Key constraint: The branch must merge to trunk within 24 hours. If it does not, you have a long-lived branch and you have lost the benefit of TBD.
Path 2: Direct Trunk Commits
Developers commit directly to trunk. Quality is ensured through pre-commit checks, pair programming, and strong automated testing.
How it works:
Pull the latest trunk
Make a small, tested change locally
Run the local build and test suite
Push directly to trunk
CI validates the commit immediately
Best for teams that:
Have strong automated test coverage
Practice pair or mob programming (which provides real-time review)
Want maximum integration frequency
Have high trust and shared code ownership
Key constraint: This requires excellent test coverage and a culture where the team owns quality collectively. Without these, direct trunk commits become reckless.
How to Choose Your Path
Ask these questions:
Do you have automated tests that catch real defects? If no, start with Path 1 and invest in testing fundamentals in parallel.
Does your organization require documented review approvals? If yes, use Path 1 with rapid pull requests.
Does your team practice pair programming? If yes, Path 2 may work immediately - pairing is a continuous review process.
How large is your team? Teams of 2-4 can adopt Path 2 more easily. Larger teams may start with Path 1 and transition later.
Both paths are valid. The important thing is daily integration to trunk. Do not spend weeks debating which path to use. Pick one, start today, and adjust.
Essential Supporting Practices
Trunk-based development does not work in isolation. These practices make daily integration safe:
Start by shortening branch lifetimes, then tighten to daily integration. The TBD Migration Guide walks through each step with team agreements, metrics, and retrospective checkpoints.
Common Pitfalls
Teams migrating to TBD commonly stumble on slow CI builds, incomplete feature flags, and treating branch renaming as real integration. See Common Pitfalls to Avoid for detailed guidance and fixes.
Once your team is integrating to trunk daily, build the test suite that makes that integration trustworthy. Continue to Testing Fundamentals.
Related Content
Evolutionary Coding Techniques - Dark code, branch by abstraction, parallel run, and expand and contract, ordered from least to most costly to maintain
TBD Migration Guide - Detailed scenarios including regulated environments, multi-team environments, and advanced pitfalls
A tactical guide for migrating from GitFlow or long-lived branches to trunk-based development, covering regulated environments, multi-team coordination, and common pitfalls.
Phase 1 - Foundations | Scope: Team
This is a detailed companion to the Trunk-Based Development overview. It covers specific migration paths, regulated environment guidance, multi-team strategies, and concrete scenarios.
This guide walks you through migrating from GitFlow or long-lived branches to trunk-based development. It covers two paths (short-lived branches and direct trunk commits), essential practices, regulated-environment compliance, and common pitfalls.
Long-lived branches hide problems. TBD exposes them early, which is why it is the first step toward continuous integration.
Why Move to Trunk-Based Development?
Long-lived branches hide problems. TBD exposes them early, when they are cheap to fix.
Think of long-lived branches like storing food in a bunker: it feels safe until you open the door and discover half of it rotting. With TBD, teams check freshness every day.
If your branches live for more than a day or two, you aren’t doing continuous integration. You’re doing periodic
integration at best. True CI requires at least daily integration to the trunk.
The First Step: Stop Letting Work Age
The biggest barrier isn’t tooling. It’s habits.
The first meaningful change is simple:
Stop letting branches live long enough to become problems.
Your first goal isn’t true TBD. It’s shorter-lived branches: changes that live for hours or a couple of days, not weeks.
That alone exposes dependency issues, unclear requirements, and missing tests, which is exactly the point. The pain tells you where improvement is needed.
Before You Start: What to Measure
You cannot improve what you don’t measure. Before changing anything, establish baseline metrics, so you can track actual progress.
You’ll discover misunderstandings upfront instead of after a week of coding.
This approach is called Behavior-Driven Development (BDD), a collaborative practice where teams define expected behavior in plain language before writing code. BDD bridges the gap between business requirements and technical implementation by using concrete examples that become executable tests.
Participants: Product Owner, Developer, Tester (15-30 minutes per story)
Process:
Product describes the user need and expected outcome
Developer asks questions about edge cases and dependencies
Tester identifies scenarios that could fail
Together, write acceptance criteria as examples
Example:
BDD scenarios for password reset
Feature: User password reset

Scenario: Valid reset request
  Given a user with email "user@example.com" exists
  When they request a password reset
  Then they receive an email with a reset link
  And the link expires after 1 hour

Scenario: Invalid email
  Given no user with email "nobody@example.com" exists
  When they request a password reset
  Then they see "If the email exists, a reset link was sent"
  And no email is sent

Scenario: Expired link
  Given a user has a reset link older than 1 hour
  When they click the link
  Then they see "This reset link has expired"
  And they are prompted to request a new one
These scenarios become your automated acceptance tests before you write any implementation code.
From Acceptance Criteria to Tests
Turn those scenarios into executable tests in your framework of choice:
Acceptance tests for password reset scenarios
// Example using Jest and Supertestdescribe('Password Reset',()=>{it('sends reset email for valid user',async()=>{awaitcreateUser({email:'user@example.com'});const response =awaitrequest(app).post('/password-reset').send({email:'user@example.com'});expect(response.status).toBe(200);expect(emailService.sentEmails).toHaveLength(1);expect(emailService.sentEmails[0].to).toBe('user@example.com');});it('does not reveal whether email exists',async()=>{const response =awaitrequest(app).post('/password-reset').send({email:'nobody@example.com'});expect(response.status).toBe(200);expect(response.body.message).toBe('If the email exists, a reset link was sent');expect(emailService.sentEmails).toHaveLength(0);});});
Now you can write the minimum code to make these tests pass. This drives smaller, more focused changes.
4. Invest in Contract Tests
Most merge pain isn’t from your code. It’s from the interfaces between services.
Define interface changes early and codify them with provider/consumer contract tests.
This lets teams integrate frequently without surprises.
Path 2: Committing Directly to the Trunk
This is the cleanest and most powerful version of TBD.
It requires discipline, but it produces the most stable delivery pipeline and the least drama.
If the idea of committing straight to main makes people panic, that’s a signal about your current testing process, not a problem with TBD.
Note on regulated environments
If you work in a regulated industry with compliance requirements (SOX, HIPAA, FedRAMP, etc.), **Path 1 with short-lived branches** is usually the better choice. Short-lived branches provide the audit trails, separation of duties, and documented approval workflows that regulators expect, while still enabling daily integration. See [TBD in Regulated Environments](#tbd-in-regulated-environments) for detailed guidance on meeting compliance requirements, and [Address Code Review Concerns](#address-code-review-concerns) for how to maintain fast review cycles with short-lived branches.
How to Choose Your Path
Use this rule of thumb:
If your team fears “breaking everything,” start with short-lived branches.
If your team collaborates well and writes tests first, go straight to trunk commits.
Both paths require the same skills:
Smaller work
Better requirements
Shared understanding
Automated tests
A reliable pipeline
The difference is pace.
Essential TBD Practices
These practices apply to both paths, whether you’re using short-lived branches or committing directly to trunk.
Use Feature Flags the Right Way
Feature flags are one of several evolutionary coding techniques that allow you to integrate incomplete work safely, and the one to reach for last. See Evolutionary Coding Techniques for the full decision hierarchy, including dark code, branch by abstraction, parallel run, and expand and contract.
Feature flags are not a testing strategy.
They are a release strategy.
Every commit to trunk must:
Build
Test
Deploy safely
Flags let you deploy incomplete work without exposing it prematurely. They don’t excuse poor test discipline.
Start Simple: Boolean Flags
You don’t need a sophisticated feature flag system to start. Begin with environment variables or simple config files.
Simple boolean flag example:
Simple boolean feature flags via environment variables
// config/features.js
module.exports ={newCheckoutFlow: process.env.FEATURE_NEW_CHECKOUT==='true',enhancedSearch: process.env.FEATURE_ENHANCED_SEARCH==='true',};// In your codeconst features =require('./config/features');
app.get('/checkout',(req, res)=>{if(features.newCheckoutFlow){returnrenderNewCheckout(req, res);}returnrenderOldCheckout(req, res);});
This is enough for most TBD use cases.
Testing Code Behind Flags
Critical: You must test both code paths, flag on and flag off.
Testing both flag states - enabled and disabled
describe('Checkout flow',()=>{describe('with new checkout flow enabled',()=>{beforeEach(()=>{
features.newCheckoutFlow =true;});it('shows new checkout UI',()=>{// Test new flow});});describe('with new checkout flow disabled',()=>{beforeEach(()=>{
features.newCheckoutFlow =false;});it('shows legacy checkout UI',()=>{// Test old flow});});});
If you only test with the flag on, you’ll break production when the flag is off.
Keep Flags Short-Lived
For TBD, most flags are temporary release flags: they hide incomplete work during integration and get removed once the feature is stable (typically 1-4 weeks). Set a removal date when you create each flag, assign an owner, and treat unremoved flags as technical debt.
For a deeper taxonomy of flag types (release flags vs. permanent configuration flags) and lifecycle management practices, see the feature flag glossary entry.
Commit Small and Commit Often
If a change is too large to commit today, split it.
Large commits are failed design upstream, not failed integration downstream.
Use TDD and ATDD to Keep Refactors Safe
Refactoring must not break tests.
If it does, you’re testing implementation, not behavior. Behavioral tests are what keep trunk commits safe.
Prioritize Interfaces First
Always start by defining and codifying the contract:
What is the shape of the request?
What is the response?
What error states must be handled?
Interfaces are the highest-risk area. Drive them with tests first. Then work inward.
Getting Started: A Tactical Guide
The initial phase sets the tone. Focus on establishing new habits, not perfection.
Step 1: Team Agreement and Baseline
Hold a team meeting to discuss the migration
Agree on initial branch lifetime limit (start with 48 hours if unsure)
Document current baseline metrics (branch age, merge frequency, build time)
Identify your slowest-running tests
Create a list of known integration pain points
Set up a visible tracker (physical board or digital dashboard) for metrics
Step 2: Test Infrastructure Audit
Focus: Find and fix what will slow you down.
Run your test suite and time each major section
Identify slow tests
Look for:
Tests with sleeps or arbitrary waits
Tests hitting external services unnecessarily
Integration tests that could be contract tests
Flaky tests masking real issues
Fix or isolate the worst offenders. You don’t need a perfect test suite to start, just one fast enough to not punish frequent integration.
Step 3: First Integrated Change
Pick the smallest possible change:
A bug fix
A refactoring with existing test coverage
A configuration update
Documentation improvement
The goal is to validate your process, not to deliver a feature.
Execute:
Create a branch (if using Path 1) or commit directly (if using Path 2)
Make the change
Run tests locally
Integrate to trunk
Deploy through your pipeline
Observe what breaks or slows you down
Step 4: Retrospective
Gather the team:
What went well:
Did anyone integrate faster than before?
Did you discover useful information about your tests or pipeline?
What hurt:
What took longer than expected?
What manual steps could be automated?
What dependencies blocked integration?
Ongoing commitment:
Adjust branch lifetime limit if needed
Assign owners to top 3 blockers
Commit to integrating at least one change per person
The initial phase won’t feel smooth. That’s expected. You’re learning what needs fixing.
Getting Your Team On Board
Technical changes are easy compared to changing habits and mindsets. Here’s how to build buy-in.
Acknowledge the Fear
When you propose TBD, you’ll hear:
“We’ll break production constantly”
“Our code isn’t good enough for that”
“We need code review on branches”
“This won’t work with our compliance requirements”
These concerns are valid signals about your current system. Don’t dismiss them.
Instead: “You’re right that committing directly to trunk with our current test coverage would be risky. That’s why we need to improve our tests first.”
Start with an Experiment
Don’t mandate TBD for the whole team immediately. Propose a time-boxed experiment:
The Proposal:
“Let’s try this for two weeks with a single small feature. We’ll track what goes well and what hurts. After two weeks, we’ll decide whether to continue, adjust, or stop.”
What to measure during the experiment:
How many times did we integrate?
How long did merges take?
Did we catch issues earlier or later than usual?
How did it feel compared to our normal process?
After two weeks:
Hold a retrospective. Let the data and experience guide the decision.
Pair on the First Changes
Don’t expect everyone to adopt TBD simultaneously. Instead:
Identify one advocate who wants to try it
Pair with them on the first trunk-based changes
Let them experience the process firsthand
Have them pair with the next person
Knowledge transfer through pairing works better than documentation.
Address Code Review Concerns
“But we need code review!” Yes. TBD doesn’t eliminate code review.
Options that work:
Pair or mob programming (review happens in real-time)
Commit to trunk, review immediately after, fix forward if issues found
Very short-lived branches (hours, not days) with rapid review SLA
Pairing on code review and review change
The goal is fast feedback, not zero review.
Important
If you're using short-lived branches that must merge within a day or two, asynchronous code review becomes a bottleneck. Even "fast" async reviews with 2-4 hour turnaround create delays: the reviewer reads code, leaves comments, the author reads comments later, makes changes, and the cycle repeats. Each round trip adds hours or days.
Instead, use **synchronous code reviews** where the reviewer and author work together in real-time (screen share, pair at a workstation, or mob). This eliminates communication delays through review comments. Questions get answered immediately, changes happen on the spot, and the code merges the same day.
If your team can't commit to synchronous reviews or pair/mob programming, you'll struggle to maintain short branch lifetimes.
Handle Skeptics and Blockers
You’ll encounter people who don’t want to change. Don’t force it.
Instead:
Let them observe the experiment from the outside
Share metrics and outcomes transparently
Invite them to pair for one change
Let success speak louder than arguments
Some people need to see it working before they believe it.
Frame TBD as a risk reduction strategy, not a risky experiment.
Working in a Multi-Team Environment
Migrating to TBD gets complicated when you depend on teams still using long-lived branches. Here’s how to handle it.
The Core Problem
You want to integrate daily. Your dependency team integrates weekly or monthly. Their API changes surprise you during their big-bang merge.
You can’t force other teams to change. But you can protect yourself.
Strategy 1: Consumer-Driven Contract Tests
Define the contract you need from the upstream service and codify it in tests that run in your pipeline.
Example using Pact:
Consumer-driven contract test using Pact
// Your consumer testconst{ pact }=require('@pact-foundation/pact');describe('User Service Contract',()=>{it('returns user profile by ID',async()=>{await provider.addInteraction({state:'user 123 exists',uponReceiving:'a request for user 123',withRequest:{method:'GET',path:'/users/123',},willRespondWith:{status:200,body:{id:123,name:'Jane Doe',email:'jane@example.com',},},});const user =await userService.getUser(123);expect(user.name).toBe('Jane Doe');});});
This test runs against your expectations of the API, not the actual service. When the upstream team changes their API, your contract test fails before you integrate their changes.
Share the contract:
Publish your contract to a shared repository
Upstream team runs provider verification against your contract
If they break your contract, they know before merging
Strategy 2: API Versioning with Backwards Compatibility
If you control the shared service:
API versioning for backwards-compatible multi-team integration
// Support both old and new API versions
app.get('/api/v1/users/:id', handleV1Users);
app.get('/api/v2/users/:id', handleV2Users);// Or use content negotiation
app.get('/api/users/:id',(req, res)=>{const version = req.headers['api-version']||'v1';if(version ==='v2'){returnhandleV2Users(req, res);}returnhandleV1Users(req, res);});
Migration path:
Deploy new version alongside old version
Update consumers one by one
After all consumers migrated, deprecate old version
Remove old version after deprecation period
Strategy 3: Strangler Fig Pattern
When you depend on a team that won’t change:
Create an anti-corruption layer between your code and theirs
Define your ideal interface in the adapter
Let the adapter handle their messy API
Strangler fig adapter to isolate a legacy dependency
// Your ideal interfaceclassUserRepository{asyncgetUser(id){// Your clean, typed interface}}// Adapter that deals with their messclassLegacyUserServiceAdapterextendsUserRepository{asyncgetUser(id){const response =awaitfetch(`https://legacy-service/users/${id}`);const messyData =await response.json();// Transform their format to yoursreturn{id: messyData.user_id,name:`${messyData.first_name}${messyData.last_name}`,email: messyData.email_address,};}}
Now your code depends on your interface, not theirs. When they change, you only update the adapter.
Strategy 4: Feature Toggles for Cross-Team Coordination
When multiple teams need to coordinate a release:
Each team develops behind feature flags
Each team integrates to trunk continuously
Features remain disabled until coordination point
Enable flags in coordinated sequence
This decouples development velocity from release coordination.
When You Can’t Integrate with Dependencies
If upstream dependencies block you from integrating daily:
Short term:
Use contract tests to detect breaking changes early
Create adapters to isolate their changes
Document the integration pain as a business cost
Long term:
Advocate for those teams to adopt TBD
Share your success metrics
Offer to help them migrate
You can’t force other teams to change. But you can demonstrate a better way and make it easier for them to follow.
TBD in Regulated Environments
Regulated industries face legitimate compliance requirements: audit trails, change traceability, separation of duties, and documented approval processes. These requirements often lead teams to believe trunk-based development is incompatible with compliance. This is a misconception.
TBD is about integration frequency, not about eliminating controls. You can meet compliance requirements while still integrating at least daily.
The Compliance Concerns
Common regulatory requirements that seem to conflict with TBD:
Audit Trail and Traceability
Every change must be traceable to a requirement, ticket, or change request
Changes must be attributable to specific individuals
History of what changed, when, and why must be preserved
Separation of Duties
The person who writes code shouldn’t be the person who approves it
Changes must be reviewed before reaching production
No single person should have unchecked commit access
Change Control Process
Changes must follow a documented approval workflow
This provides stronger separation of duties than long-lived branches because:
Reviews happen while context is fresh
Reviewers can actually understand the small changeset
Automated checks enforce policies consistently
Change Control Process:
Branch protection rules enforce your process:
Example GitHub branch protection rules for trunk
# Example GitHub branch protection for trunkrequired_reviews:1required_checks:- unit-tests
- security-scan
- compliance-validation
dismiss_stale_reviews:truerequire_code_owner_review:true
This ensures:
No direct commits to trunk (except in documented break-glass scenarios)
Required approvals before merge
Automated validation gates
Audit log of every merge decision
Documentation Requirements:
Pull request templates enforce documentation:
Pull request template for compliance documentation
## Change Description
[Link to Jira ticket]
## Risk Assessment- [ ] Low risk: Configuration only
- [ ] Medium risk: New functionality, backward compatible
- [ ] High risk: Database migration, breaking change
## Testing Evidence- [ ] Unit tests added/updated
- [ ] Integration tests pass
- [ ] Manual testing completed (attach screenshots if UI change)
- [ ] Security scan passed
## Rollback Plan
[How to rollback if this causes issues in production]
What “Short-Lived” Means in Practice
Hours, not days:
Simple bug fixes: 2-4 hours
Small feature additions: 4-8 hours
Refactoring: 1-2 days
Maximum 2 days:
If a branch can’t merge within 2 days, the work is too large. Decompose it further or use feature flags to integrate incomplete work safely.
Daily integration requirement:
Even if the feature isn’t complete, integrate what you have:
Behind a feature flag if needed
As internal APIs not yet exposed
As tests and interfaces before implementation
Compliance-Friendly Tooling
Modern platforms provide compliance features built-in:
Git Hosting (GitHub, GitLab, Bitbucket):
Immutable audit logs
Branch protection rules
Required approvals
Status check enforcement
Signed commits for authenticity
Pipeline Platforms:
Deployment approval gates
Audit trails of every deployment
Environment-specific controls
Automated compliance checks
Feature Flag Systems:
Change deployment without code deployment
Gradual rollout controls
Instant rollback capability
Audit log of flag changes
Secrets Management:
Vault, AWS Secrets Manager, Azure Key Vault
Audit log of secret access
Rotation policies
Environment isolation
Example: Compliant Short-Lived Branch Workflow
Monday 9 AM:
Developer creates branch feature/JIRA-1234-add-audit-logging from trunk.
Monday 9 AM to 2 PM:
Developer implements audit logging for user authentication events. Commits reference JIRA-1234. Automated tests run on each commit.
Monday 2 PM:
Developer opens pull request:
Title: “JIRA-1234: Add audit logging for authentication events”
Description includes risk assessment, testing evidence, rollback plan
Monday 4:30 PM:
Deployment gate requires manual approval for production. Tech lead approves based on risk assessment.
Monday 4:35 PM:
Automated deployment to production. Audit log captures: what deployed, who approved, when, what checks passed.
Total time: 7.5 hours from branch creation to production.
Full compliance maintained. Full audit trail captured. Daily integration achieved.
When Long-Lived Branches Hide Compliance Problems
Ironically, long-lived branches often create compliance risks:
Stale Reviews:
Reviewing a 3-week-old, 2000-line pull request is performative, not effective. Reviewers rubber-stamp because they can’t actually understand the changes.
Integration Risk:
Big-bang merges after weeks introduce unexpected behavior. The change that was reviewed isn’t the change that actually deployed (due to merge conflicts and integration issues).
Delayed Feedback:
Problems discovered weeks after code was written are expensive to fix and hard to trace to requirements.
Audit Trail Gaps:
Long-lived branches often have messy commit history, force pushes, and unclear attribution. The audit trail is polluted.
Regulatory Examples Where Short-Lived Branches Work
Financial Services (SOX, PCI-DSS):
Short-lived branches with required approvals
Automated security scanning on every PR
Separation of duties via required reviewers
Immutable audit logs in Git hosting platform
Feature flags for gradual rollout and instant rollback
Healthcare (HIPAA):
Pull request templates documenting PHI handling
Automated compliance checks for data access patterns
Required security review for any PHI-touching code
Audit logs of deployments
Environment isolation enforced by the pipeline
Government (FedRAMP, FISMA):
Branch protection requiring government code owner approval
Automated STIG compliance validation
Signed commits for authenticity
Deployment gates requiring authority to operate
Complete audit trail from commit to production
What Will Hurt (At First)
When you migrate to TBD, you’ll expose every weakness you’ve been avoiding:
Trunk must always be production-ready; fix broken builds immediately
Forgetting TBD is a means, not an end
Outcomes
Measure cycle time, defect rates, and deployment frequency, not just commit counts
Pitfall 1: Treating TBD as Just a Branch Renaming Exercise
The mistake:
Renaming develop to main and calling it TBD.
Why it fails:
You’re still doing long-lived feature branches, just with different names. The fundamental integration problems remain.
What to do instead:
Focus on integration frequency, not branch names. Measure time-to-merge, not what you call your branches.
Pitfall 2: Merging Daily Without Actually Integrating
The mistake:
Committing to trunk every day, but your code doesn’t interact with anyone else’s work. Your tests don’t cover integration points.
Why it fails:
You’re batching integration for later. When you finally connect your component to the rest of the system, you discover incompatibilities.
What to do instead:
Ensure your tests exercise the boundaries between components. Use contract tests for service interfaces. Integrate at the interface level, not just at the source control level.
Pitfall 5: Keeping Flags Forever
The mistake:
Creating feature flags and never removing them. Your codebase becomes a maze of conditionals.
Why it fails:
Every permanent flag doubles your testing surface area and increases complexity. Eventually, no one knows which flags do what.
What to do instead:
Set a removal date when creating each flag. Track flags like technical debt. Remove them aggressively once features are stable.
When to Pause or Pivot
Sometimes TBD migration stalls or causes more problems than it solves. Here’s how to tell if you need to pause and what to do about it.
Signs You’re Not Ready Yet
Red flag 1: Your test suite takes hours to run
If developers can’t get feedback in minutes, they can’t integrate frequently. Forcing TBD now will just slow everyone down.
What to do:
Pause the TBD migration. Invest 2-4 weeks in making tests faster. Parallelize test execution. Remove or optimize the slowest tests. Resume TBD when feedback takes less than 10 minutes.
Red flag 2: More than half your tests are flaky
If tests fail randomly, developers will ignore failures. You’ll integrate broken code without realizing it.
What to do:
Stop adding new features. Spend one sprint fixing or deleting flaky tests. Track flakiness metrics. Only resume TBD when you trust your test results.
Red flag 3: Production incidents increased significantly
If TBD caused a spike in production issues, something is wrong with your safety net.
What to do:
Revert to short-lived branches (48-72 hours) temporarily. Analyze what’s escaping to production. Add tests or checks to catch those issues. Resume direct-to-trunk when the safety net is stronger.
Red flag 4: The team is in constant conflict
If people are fighting about the process, frustrated daily, or actively working around it, you’ve lost the team.
What to do:
Hold a retrospective. Listen to concerns without defending TBD. Identify the top 3 pain points. Address those first. Resume TBD migration when the team agrees to try again.
Signs You’re Doing It Wrong (But Can Fix It)
Yellow flag 1: Daily commits, but monthly integration
You’re committing to trunk, but your code doesn’t connect to the rest of the system until the end.
What to fix:
Focus on interface-level integration. Ensure your tests exercise boundaries between components. Use contract tests.
Yellow flag 2: Trunk is broken often
If trunk is red more than 5% of the time, something’s wrong with your testing or commit discipline.
What to fix:
Make “fix trunk immediately” the top priority. Consider requiring local tests to pass before pushing. Add pre-commit hooks if needed.
Yellow flag 3: Feature flags piling up
If you have more than 5 active flags, you’re not cleaning up after yourself.
What to fix:
Set a team rule: “For every new flag created, remove an old one.” Dedicate time each sprint to flag cleanup.
How to Pause Gracefully
If you need to pause:
Communicate clearly:
“We’re pausing TBD migration for two weeks to fix our test infrastructure. This isn’t abandoning the goal.”
Set a specific resumption date:
Don’t let “pause” become “quit.” Schedule a date to revisit.
Fix the blockers:
Use the pause to address the specific problems preventing success.
Retrospect and adjust:
When you resume, what will you do differently?
Pausing isn’t failure. Pausing to fix the foundation is smart.
What “Good” Looks Like
You know TBD is working when:
Branches live for hours, not days
Developers collaborate early instead of merging late
Product participates in defining behaviors, not just writing stories
Tests run fast enough to integrate frequently
Deployments are boring
You can fix production issues with the same process you use for normal work
When your deployment process enables emergency fixes without special exceptions, you’ve reached the real payoff:
lower cost of change, which makes everything else faster, safer, and more sustainable.
Concrete Examples and Scenarios
Theory is useful. Examples make it real. Here are practical scenarios showing how to apply TBD principles.
Scenario 1: Breaking Down a Large Feature
Problem:
You need to build a user notification system with email, SMS, and in-app notifications. Estimated: 3 weeks of work.
Old approach (GitFlow):
Create a feature/notifications branch. Work for three weeks. Submit a massive pull request. Spend days in code review and merge conflicts.
TBD approach:
The interface and its implementations are new code with no existing caller, so they ship as dark code first. Only the final send behavior, which has a real user-facing effect, needs a feature flag.
First commit: Define notification interface, commit to trunk
Day 1: NotificationService contract
// notifications/NotificationService.js// Contract: all implementations must provide send(userId, message)// message shape: { title, body, priority } where priority is 'low', 'normal', or 'high'classNotificationService{asyncsend(userId, message){thrownewError('Not implemented');}}
This compiles but doesn’t do anything yet. That’s fine.
Next commit: Add in-memory implementation for testing
Now other teams can use the interface in their code and tests.
Then: Implement email notifications behind a feature flag
Days 3-5: EmailNotificationService behind a flag
classEmailNotificationServiceextendsNotificationService{asyncsend(userId, message){if(!features.emailNotifications){return;// No-op when disabled}// Real email sending implementation}}
Commit and deploy. Now new data populates both formats.
Step 3: Backfill
Migrate existing data in the background:
Step 3: backfill existing rows
asyncfunctionbackfillNames(){const users =await db.query('SELECT id, name FROM users WHERE first_name IS NULL');for(const user of users){const[firstName, lastName]= user.name.split(' ');await db.query('UPDATE users SET first_name = ?, last_name = ? WHERE id = ?',[firstName, lastName, user.id]);}}
Run this as a background job. Commit and deploy.
Step 4: Read from new columns
Update read path behind a feature flag:
Step 4: read from new columns behind a flag
asyncfunctiongetUser(id){const user =await db.query('SELECT * FROM users WHERE id = ?',[id]);if(features.useNewNameColumns){return{firstName: user.first_name,lastName: user.last_name,};}return{name: user.name };}
Deploy and gradually enable the flag.
Step 5: Contract
Once all reads use new columns and flag is removed:
Step 5: drop the old column
ALTERTABLE users DROPCOLUMN name;
Result: Five deployments instead of one big-bang change. Each step was reversible. Zero downtime.
Scenario 3: Refactoring Without Breaking the World
Problem:
Your authentication code is a mess. You want to refactor it without breaking production.
TBD approach:
Characterization tests
Write tests that capture current behavior (warts and all):
Characterization tests for existing auth behavior
describe('Current auth behavior',()=>{it('accepts password with special characters',()=>{// Document what currently happens});it('handles malformed tokens by returning 401',()=>{// Capture edge case behavior});});
These tests document how the system actually works. Commit.
Remove old code
Once all endpoints use modern auth and it has been stable:
Remove the legacy implementation
classAuthService{asyncauthenticate(credentials){// Just the modern implementation}}
Delete the legacy code entirely.
Result: Continuous refactoring without a “big rewrite” branch. Production was never at risk.
Scenario 4: Working with External API Changes
Problem:
A third-party API you depend on is changing their response format next month.
TBD approach:
Adapter pattern
Create an adapter that normalizes both old and new formats:
Adapter handling both old and new API formats
classPaymentAPIAdapter{asyncgetPaymentStatus(orderId){const response =awaitfetch(`https://api.payments.com/orders/${orderId}`);const data =await response.json();// Handle both old and new formatif(data.payment_status){// Old formatreturn{status: data.payment_status,amount: data.total_amount,};}else{// New formatreturn{status: data.status.payment,amount: data.amounts.total,};}}}
Commit. Your code now works with both formats.
After the API migration:
Simplify adapter to only handle new format:
Simplified adapter for new format only
asyncgetPaymentStatus(orderId){const response =awaitfetch(`https://api.payments.com/orders/${orderId}`);const data =await response.json();return{status: data.status.payment,amount: data.amounts.total,};}
Result: No coupling between your deployment schedule and the external API migration. Zero downtime.
Migrating from GitFlow to TBD isn’t a matter of changing your branching strategy.
It’s a matter of changing your thinking.
Stop optimizing for isolation.
Start optimizing for feedback.
Small, tested, integrated changes, delivered continuously, will always outperform big batches delivered occasionally.
That’s why teams migrate to TBD.
Not because it’s trendy, but because it’s the only path to real continuous integration and continuous delivery.
2 - Evolutionary Coding Techniques
Choose the least intrusive technique for integrating incomplete work to trunk, from dark code to feature flags as a last resort.
Phase 1 - Foundations | Scope: Team
Trunk-based development requires integrating incomplete work daily without breaking trunk or exposing half-built features to users. This section covers the techniques that make that possible, ordered from least to most costly to maintain.
Deployment Is Not Release
Deployment is a technical action: pushing code to production. Release is a business decision: making a capability available to users. Evolutionary coding techniques are how you deploy continuously while controlling release independently.
Feature flags are the best-known way to make that separation, which is why teams reach for them first. But a runtime if (flag) branch is conditional complexity: every flag combination has to be tested, and the flag has to be deleted later or it becomes permanent debt. Most incomplete work does not need a flag at all. It needs to be structured so the unfinished parts are inert until they are ready.
Use the least intrusive technique that solves the problem. Reach for a flag only when nothing simpler applies.
Ongoing lifecycle management: an owner, a removal date, and combinatorial test cases until it’s deleted.
How to Choose
Ask these questions in order. Stop at the first “yes.”
Can the change be introduced additively, with nothing pointing to it yet? Use dark code.
Does an existing interface already isolate this behavior, or can you extract one first? Use branch by abstraction.
Do you need to prove the new logic produces the same answer as the old logic before you trust it? Use parallel run.
Are you changing a shared contract, like a database schema or an API, that other code or services depend on? Use expand and contract.
Are you replacing a whole subsystem or service, not a single implementation? Use the strangler fig pattern at the routing layer.
Is this strictly a business release timing decision, such as a coordinated launch, a kill switch, an entitlement, or an experiment, that none of the above can express? Use a feature flag, and only at the edge of the system.
Reaching question 6 is a legitimate reason to flag. Reaching for a flag at question 1 is not.
Rules If You Do Reach for a Flag
Flag at the edge, not in domain logic. Put the check in a controller, router, or top-level entry point, never buried inside business logic or a data-access layer.
Give every flag an expiration date at creation time. No date means the flag is permanent, and permanent release flags are debt.
Create the removal ticket in the same pull request that adds the flag. Not later.
Never nest flags. If capability B depends on capability A, extend A’s flag instead of stacking a second flag on top of it.
See Feature Flags for the full flag lifecycle, from creation through removal.
Key Pitfalls
1. “We used a flag because it was the tool we already knew”
Familiarity is not a reason to skip the hierarchy. A flag left in place after launch is technical debt that dark code or branch by abstraction would never have created in the first place.
2. “We picked branch by abstraction, but nothing was calling the old code through an interface yet”
Extract the interface first, as its own zero-behavior-change commit, before starting the swap. Introducing an abstraction and a new implementation in the same change makes the abstraction hard to review on its own merits.
3. “We treated a database migration like a code refactor”
A shared schema or API is a contract other people’s code depends on. Use expand and contract rather than branch by abstraction for anything consumed outside your own codebase.
Next Step
These techniques are what make trunk-based development safe for incomplete work. Once your team can integrate daily without flag sprawl, continue building the test architecture that backs it.
Small Batches - the batch-sizing discipline these techniques support
2.1 - Dark Code
Deploy new logic to production before anything calls it, so it carries zero release risk until you wire it in.
Phase 1 - Foundations | Scope: Team
Dark code is the default technique for integrating incomplete work. It costs nothing to maintain and requires no cleanup, because the code never runs until you decide to connect it.
What Is Dark Code?
Dark code is new logic that is fully built, tested, and deployed to production, but not yet reachable. No route, UI trigger, or message consumer points to it. It sits inert in the running binary until the final commit connects it.
This is sometimes called “connect tests last” or a “dark launch,” because the implementation is complete; only the wiring is missing.
What Dark Code Is Not
It is not dead code left behind after a change. Dark code is temporary and has a defined moment it becomes live.
It is not a feature flag. There is no runtime check and no conditional branch. The only cleanup is the wiring commit itself, which is not cleanup at all.
It is not untested. The code has full unit and integration test coverage before it deploys; only production traffic hasn’t reached it yet.
What Dark Code Improves
Problem
How Dark Code Helps
A feature takes multiple days or weeks to build
Each piece integrates and deploys daily; only the last commit exposes it
No flag is created, so there’s nothing to track or remove later
Fear of half-built features reaching users
Code with no caller cannot be reached by any user, regardless of deployment frequency
Large, risky final pull requests
The final change is a small wiring commit, not the whole feature
Building Behind Dark Code
Step 1: Build the implementation
Write the domain logic, service, or component with its own unit and integration tests, exactly as you would if it were shipping today. Commit and deploy continuously as you go.
Step 2: Deploy without wiring
Each commit ships to production. The code compiles, is tested, and runs inside the deployed artifact, but nothing calls it. There is no behavior change for users, because there is no path to the new code.
Dark code: new service deployed with no caller
// discountEngine.js - deployed, tested, unreferencedclassDiscountEngine{calculate(cart){// Fully implemented and unit tested}}
module.exports = DiscountEngine;// Nothing in the request handlers imports DiscountEngine yet.// It ships with every deploy and does nothing until it's wired in.
Step 3: Wire it in as the final change
Once the implementation is complete and reviewed, the last pull request adds the entry point: the route, the UI trigger, or the consumer binding.
This commit is small and easy to review, because all the risk was already tested and deployed in the commits before it.
When Dark Code Is Not Enough
Dark code works when you control every caller and can wait to wire the last one in. It does not work when:
You need to compare the new logic against production behavior before trusting it. Use parallel run instead.
You are replacing an implementation that already has live callers. Use branch by abstraction instead.
The business needs the release timed independently of when the code is ready, such as a coordinated launch or a gradual percentage rollout. Use a feature flag instead.
Key Pitfalls
1. “We wired it in early to test in production”
If you need production traffic to validate the new code before trusting it, that is a parallel run, not dark code. Wiring in an unfinished path to see what happens exposes users to unfinished work.
2. “The dark code sat unwired for three months”
Dark code should be wired in within days, not months. If the entry point keeps slipping, the feature isn’t actually close to done, and calling it dark code is hiding that from the team.
Measuring Success
Metric
Target
Why It Matters
Time from first dark commit to wiring
Days
Confirms dark code isn’t a substitute for finishing the feature
Size of the final wiring commit
Small: a route or binding, not logic
Confirms the risk was already tested and deployed incrementally
Feature flags created per sprint
Decreasing as dark code adoption increases
Confirms flags are reserved for cases dark code can’t cover
Next Step
When you’re replacing an implementation that already has live callers instead of adding a new one, use Branch by Abstraction.
Feature Flags - the alternative to reach for once dark code doesn’t apply
Small Batches - deploying each piece of a feature continuously
2.2 - Branch by Abstraction
Replace an existing implementation behind a stable interface, one small commit at a time, without a long-lived branch.
Phase 1 - Foundations | Scope: Team
Branch by abstraction lets you replace an internal implementation, algorithm, or library on trunk, without a long-lived branch and without disrupting the code that already depends on it.
What Is Branch by Abstraction?
Branch by abstraction introduces an interface over an existing implementation, redirects callers to that interface, then builds and switches in a new implementation behind it, all as small commits on trunk. The “branching” happens in the abstraction layer, not in version control.
The technique gets its name because it replaces a source-control branch with a branch in the code itself: an interface with two implementations, one of which is live.
What Branch by Abstraction Is Not
It is not a long-lived feature branch with an interface added to justify it. If the work still takes weeks on a branch, the abstraction hasn’t replaced anything.
It is not the strangler fig pattern. Branch by abstraction swaps an implementation behind an in-process interface. Strangler fig replaces a whole subsystem or service by routing traffic to it at a system boundary. Use branch by abstraction inside a codebase you own; use strangler fig when the thing being replaced is bigger than one component.
It is not a permanent abstraction layer. Once the swap is complete, remove the old implementation, and remove the interface too if nothing else needs it.
What Branch by Abstraction Improves
Problem
How Branch by Abstraction Helps
Large refactors force a long-lived branch
The refactor happens in small commits on trunk, behind an interface
Fear of breaking existing callers during a rewrite
Callers depend on the interface, not the implementation, so the swap is invisible to them
“Big bang” cutover risk
The switch is a single dependency-injection change, easy to revert
Dead code left behind after a migration
The interface makes the old implementation easy to find and delete
Making the Swap
Step 1: Abstract
Introduce an interface over the existing code and redirect every caller to it. This is a zero-behavior-change commit: the interface wraps the current implementation and nothing else changes.
Step 1: introduce the interface over the existing implementation
classAuthService{authenticate(credentials){// existing implementation, moved behind the interface unchanged}}// callers now depend on AuthService, not the concrete legacy classconst auth =newAuthService();
Step 2: Implement
Build the new implementation alongside the old one, as its own class. Commit and deploy the new class in small pieces; it isn’t wired to any caller yet, so it carries the same zero risk as dark code.
Step 2: build the new implementation alongside the old one
classLegacyAuthService{authenticate(credentials){// existing messy implementation, untouched}}classModernAuthService{authenticate(credentials){// new implementation, built and tested incrementally}}
Step 3: Switch
Change the dependency injection or factory binding to instantiate the new implementation instead of the old one. This is the entire cutover: one line, one commit, easy to revert.
Step 3: switch the binding to the new implementation
// container.js
container.register('AuthService', ModernAuthService);// was LegacyAuthService
If you need to de-risk the switch further, or need confidence the two implementations produce identical results first, run them side by side with a parallel run before flipping the binding.
Step 4: Prune
Delete the legacy implementation. Delete the interface too if only one implementation remains and nothing else depends on the abstraction.
Step 4: delete the legacy implementation
classAuthService{authenticate(credentials){// just the modern implementation now}}
Cleanup here is a straightforward deletion of a class. There is no scattered if/else logic to search for, because the old and new implementations were never in the same function.
Key Pitfalls
1. “We built the new implementation and the interface in the same commit”
This makes the abstraction hard to review on its own merits, and it removes the option to ship the interface as a safe, standalone step. Extract the interface first, verify it changes nothing, then start on the new implementation.
2. “We left the old implementation in place after the switch”
The switch commit is not the finish line. If the old class is still in the codebase a month later, delete it. An unused implementation behind a working interface is exactly the kind of dead weight branch by abstraction is supposed to avoid.
3. “We used branch by abstraction to replace a whole service”
If the replacement spans multiple components, teams, or a system boundary, that’s a strangler fig problem, not an in-process interface swap.
Measuring Success
Metric
Target
Why It Matters
Time from abstraction to switch
Days to a few weeks
Confirms the technique is replacing a branch, not becoming one
Legacy implementations still in the codebase after switch
Zero after the agreed cleanup window
Confirms pruning actually happens
Commits per swap
Many small commits, no single large diff
Confirms the refactor stayed on trunk in small pieces
Next Step
If you need to prove the new implementation matches production behavior before switching the binding, use Parallel Run.
Run a new implementation alongside the old one in production and compare results before you trust it.
Phase 1 - Foundations | Scope: Team
A parallel run executes the old and new code paths against the same production input, but only returns the old result to the caller. It proves correctness with real traffic before anyone depends on the new path.
What Is a Parallel Run?
A parallel run, sometimes called shadowing or a dark launch of logic, wraps a call so both the current implementation and a candidate replacement execute against identical production input. The caller always receives the current implementation’s result. The candidate’s result is captured and compared, never returned.
This technique is best known from GitHub’s open-source Scientist library, which formalized the pattern for verifying refactors of high-risk code paths.
What a Parallel Run Is Not
It is not a percentage rollout. Every request runs through both implementations; nothing is split between them. Percentage rollout is a feature flag concern that comes after a parallel run has already established parity.
It is not A/B testing or hypothesis-driven development. Users never see the candidate’s output during a parallel run, so it measures technical correctness, not user response.
It is not a permanent architecture. The comparison harness is temporary scaffolding, removed once the candidate becomes the primary path.
What a Parallel Run Improves
Problem
How a Parallel Run Helps
High-risk rewrites of pricing, billing, or calculation logic
Mismatches surface on real production input before the new logic is trusted
“We think the refactor is equivalent, but we’re not sure”
Telemetry gives statistical confidence instead of a guess
Regressions that only show up on rare production inputs
Every production request exercises both paths, including edge cases test suites miss
Risky migrations with no rollback story
The old path stays authoritative until the data proves the new one is safe
Running the Comparison
Step 1: Wrap the call
Introduce a thin proxy around the existing call. The caller’s contract does not change.
Step 1: wrap the call so both implementations execute
asyncfunctioncalculatePrice(order){const legacyResult =await legacyPricingEngine.calculate(order);// Fire the candidate asynchronously; never let it affect the responseshadowRun(()=> modernPricingEngine.calculate(order), legacyResult, order);return legacyResult;}
Step 2: Run the candidate and compare
Run the new implementation against the same input, in the background, and log any mismatch along with enough context to debug it.
Track mismatch rate, candidate error rate, and performance delta over a statistically meaningful window. Investigate every mismatch; each one is either a genuine bug in the candidate or a case where the legacy behavior was wrong and needs a deliberate decision.
Step 4: Cut over and remove the harness
Once the mismatch rate holds at zero for the agreed period, switch the candidate to the primary path, typically with branch by abstraction, and delete the comparison harness. Leaving it in place after cutover is unnecessary runtime cost with no further benefit.
When a Parallel Run Is Not Enough
The old and new implementations must not both execute, for example when the operation has side effects like sending an email or charging a card. Idempotent, side-effect-free logic (pricing, scoring, routing decisions) is what parallel run is for. For operations with side effects, use branch by abstraction with a smaller, monitored rollout instead.
You are changing a shared schema or contract, not just an implementation. Use expand and contract instead.
Key Pitfalls
1. “We let the candidate’s exceptions bubble up to the caller”
The candidate’s failures must never affect the response. Catch and log every exception from the candidate path independently of the legacy path.
2. “We ran the comparison for a day and called it proven”
A parallel run needs enough volume and enough time to cover the input space that matters, including rare edge cases and periodic patterns like end-of-month billing. Set the comparison window based on when those cases actually occur, not a fixed number of days.
3. “We kept the shadow harness running after cutover”
The harness is temporary. Once the candidate is primary and stable, remove the shadow call entirely. Running both implementations forever doubles compute cost for no ongoing benefit.
Measuring Success
Metric
Target
Why It Matters
Mismatch rate
Trending to zero before cutover
The core signal that the candidate is safe to promote
Candidate error rate
Zero, independent of the legacy path
Confirms the candidate doesn’t crash on real production input
Time from shadow start to harness removal
Weeks, not indefinite
Confirms the harness is treated as temporary scaffolding
Next Step
If the change touches a shared database schema or an API contract rather than a single implementation, use Expand and Contract.
Change Failure Rate - the metric a parallel run protects for high-risk changes
2.4 - Expand and Contract
Evolve a shared database schema or API contract across non-breaking phases instead of mutating it in place.
Phase 1 - Foundations | Scope: Team
Expand and contract, also called parallel change, replaces a single breaking schema or contract change with a sequence of small, backward-compatible deployments. Nothing outside your team has to be redeployed in lockstep.
What Is Expand and Contract?
Expand and contract evolves a shared contract, a database schema, an event schema, or an API, without ever mutating it in place. Instead of replacing the old shape with the new one in a single change, you add the new shape alongside the old one, migrate consumers over incrementally, and only remove the old shape once nothing depends on it.
The name comes from the two ends of the sequence: you expand the contract to support both shapes at once, then contract it back down to just the new shape.
What Expand and Contract Is Not
It is not a single migration script run during a deployment window. Each phase is its own independent, reversible deployment.
It is not limited to databases. The same four phases apply to API fields, event schemas, and message formats: anything with more than one reader or writer.
It is not optional for shared contracts. Branch by abstraction is enough when only your own code depends on the thing you’re changing. Once another service, another team, or stored data depends on it, use expand and contract instead.
What Expand and Contract Improves
Problem
How Expand and Contract Helps
Coordinated multi-service deployments for a schema change
Each phase deploys independently; producers and consumers never need to deploy at the same instant
Downtime during database migrations
The schema is never in a state where old and new code can’t both function
No rollback path for a breaking change
Every phase is reversible on its own; you can pause or back out at any step
Consumers of an API broken by a field change
Old and new fields coexist until every consumer has migrated
The Four Phases
Phase 1: Expand
Add the new shape alongside the old one. Nothing reads from it yet, and nothing that currently works stops working.
asyncfunctionbackfillNames(){const users =await db.query('SELECT id, name FROM users WHERE first_name IS NULL');for(const user of users){const[firstName, lastName]= user.name.split(' ');await db.query('UPDATE users SET first_name = ?, last_name = ? WHERE id = ?',[firstName, lastName, user.id]);}}
Deploy the dual-write change, then run the backfill as its own job. Both are independently reversible: if the backfill has a problem, the application still works off the old column.
For an API, this phase is a tolerant reader: consumers ignore fields they don’t recognize, and producers populate both the old and new field until every consumer has moved.
Phase 3: Dual-read and cutover
Switch reads to consume the new shape, one caller at a time.
Phase 3: switch reads to the new columns
asyncfunctiongetUser(id){const user =await db.query('SELECT * FROM users WHERE id = ?',[id]);return{firstName: user.first_name,lastName: user.last_name,};}
Because Phase 2 guarantees the new columns are always populated, this switch has nothing to migrate; it’s a straightforward read-path change deployed independently of the write-path change that came before it.
Phase 4: Contract
Once every reader and writer uses the new shape exclusively, remove the old one.
Phase 4: drop the old column
ALTERTABLE users DROPCOLUMN name;
For an API, this phase is deprecating and eventually removing the old field or version, once telemetry confirms no consumer still calls it.
Result: four independent deployments instead of one big-bang change. Each one is reversible on its own, and none of them requires another team or service to redeploy in the same window.
When Expand and Contract Is Not Enough
If the two shapes cannot coexist even briefly, for example a uniqueness constraint that the old and new schema can’t both satisfy, you need a more deliberate migration plan with an explicit maintenance window. That is the exception, not the default: most schema and contract changes can be expressed as expand and contract if you’re willing to take more, smaller steps.
Key Pitfalls
1. “We skipped the backfill and just changed the read path”
Reads that assume the new column is populated will fail or return nulls for any row that predates the change. Backfill before cutting over reads, not after.
2. “We dropped the old column right after the dual-write phase”
The contract phase must wait until every writer and every reader has confirmed to use the new shape only. Removing the old column while any code, including code outside your immediate deploy, still references it turns a safe migration into an outage.
3. “We coordinated the four phases into one deployment”
Collapsing the phases back into a single deployment defeats the purpose. Each phase exists so it can be deployed, verified, and rolled back independently.
Measuring Success
Metric
Target
Why It Matters
Deployments per contract change
Four independent, small deployments
Confirms the migration stayed incremental
Downtime during migration
Zero
Confirms no phase required a maintenance window
Time from expand to contract
Weeks, bounded by an agreed deadline
Confirms the old shape doesn’t linger indefinitely
Consumers still on the old shape at contract time
Zero
Confirms the contract phase is actually safe to run
Branch by Abstraction - the equivalent technique for implementations with no shared contract
TBD Migration Guide - a full worked scenario of expand and contract on a database schema
Application Configuration - keeping environment-specific values out of the artifacts this pattern deploys
Rollback - why each phase of expand and contract must be independently reversible
3 - Testing Fundamentals
Build a test architecture that gives your pipeline the confidence to deploy any change, even when dependencies outside your control are unavailable.
Phase 1 - Foundations | Scope: Team
Continuous delivery requires that trunk always be releasable, which means testing it automatically on every change. A collection of tests is not enough. You need a test architecture: different test types working together so the pipeline can confidently deploy any change, even when external systems are unavailable.
Testing Goals for CD
Your test suite must meet these goals before it can support continuous delivery.
Goal
Target
How to Measure
Fast
CI gating tests < 10 minutes; full acceptance suite < 1 hour
CI gating suite duration; full acceptance suite duration
Deterministic
Same code always produces the same result
Flaky test count: 0 in the gating suite
Catches real bugs
Tests fail when behavior is wrong, not when implementation changes
Defect escape rate trending down
Independent of external systems
Pipeline can determine deployability without any dependency being available
Definitions for testing terms as this site uses them
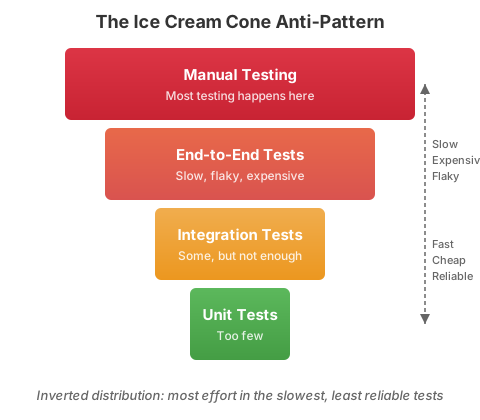
The Ice Cream Cone: What to Avoid
An inverted test distribution, with too many slow end-to-end tests and too few fast unit tests, is the most common testing barrier to CD.
The ice cream cone makes CD impossible. Manual testing gates block every release. End-to-end tests
take hours, fail randomly, and depend on external systems being healthy. For the test architecture
that replaces this, see Pipeline Test Strategy
and the Testing reference.
Next Step
Automate your build process so that building, testing, and packaging happen with a single command. Continue to Build Automation.
Inverted Test Pyramid - Anti-pattern where too many slow E2E tests replace fast unit tests
Pressure to Skip Testing - Anti-pattern where testing is treated as optional under deadline pressure
3.1 - Test Architecture
Test architecture, types, and good practices for building confidence in your delivery pipeline.
A test architecture that lets your pipeline deploy confidently, regardless of external system availability, is a core CD capability. The Test Types pages cover each type in depth.
A CD pipeline’s job is to force every artifact to prove it is worthy of delivery. That proof only works when test changes ship with the code they validate. If a developer adds a feature but the corresponding tests arrive in a later commit, the pipeline approved an artifact it never actually verified. That is not a CD pipeline. It is a CI pipeline with a deploy step. Tests and production code must always travel together through the pipeline as a single unit of change.
Beyond the Test Pyramid
The test pyramid says: write many fast unit tests at the base, fewer integration tests in the middle, and only a handful of end-to-end tests at the top. The underlying principle is sound - lower-level tests are faster, more deterministic, and cheaper to maintain.
The principle behind the shape
The pyramid’s shape communicates a principle: prefer fast, deterministic tests that you fully control. Tests at the
base are cheap to write, fast to run, and reliable. Tests at the top are slow, expensive, and depend on systems outside
your control. The more weight you put at the base, the faster and more reliable your pipeline becomes - to a point. We also have the engineering goal of achieving the most functional coverage with the fewest number of tests. Every test costs money to maintain and adds time to the pipeline.
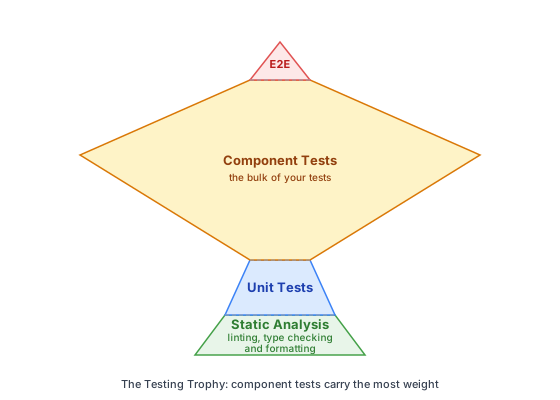
The testing trophy
The testing trophy, popularized by Kent C. Dodds, rebalances the pyramid by putting component tests at the center. Where the pyramid emphasizes unit tests at the base, the trophy argues that component tests give you the most confidence per test because they exercise realistic user behavior through a component’s public interface while still using test doubles for external dependencies.
The trophy also makes static analysis explicit as the foundation. Linting, type checking, and formatting catch entire categories of defects for free - no test code to write or maintain.
Both models agree on the principle: keep end-to-end tests few and focused, and maximize fast, deterministic coverage. The trophy simply shifts where that coverage concentrates. For teams building component-heavy applications, the trophy distribution often produces better results than a strict pyramid.
Teams often miss this underlying principle and treat either shape as a metric. They count tests by type and debate ratios - “do we have enough unit tests?” or “are our integration tests too many?” - when the real question is:
Can our pipeline determine that a change is safe to deploy without depending on any system we do not control?
A pipeline that answers yes can deploy at any time - even when a downstream service is down, a third-party API is slow, or a partner team hasn’t shipped yet. That independence is what CD requires, and it is the reason the pyramid favors the base.
What this looks like in practice
A test architecture that achieves this has three responsibilities:
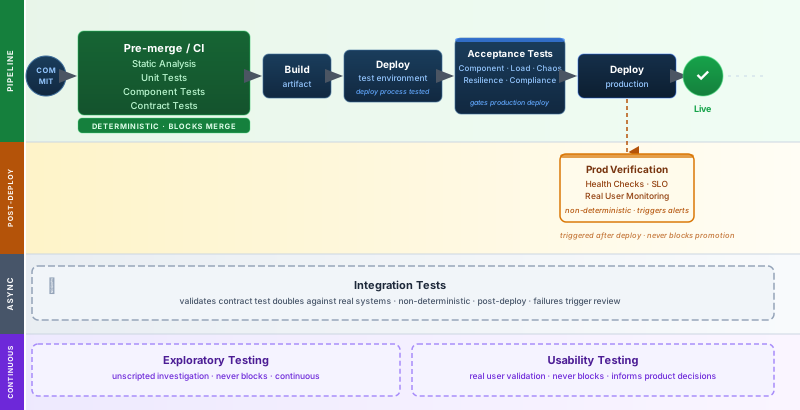
Fast, deterministic tests - unit, component, and contract tests - run on every commit using test doubles for external dependencies. They give a reliable go/no-go signal in minutes.
Acceptance tests validate that a deployed artifact is deliverable. Acceptance testing is not a single test type. It is a pipeline stage that can include component tests, load tests, chaos tests, resilience tests, and compliance tests. Any test that runs after CI to gate promotion to production is an acceptance test.
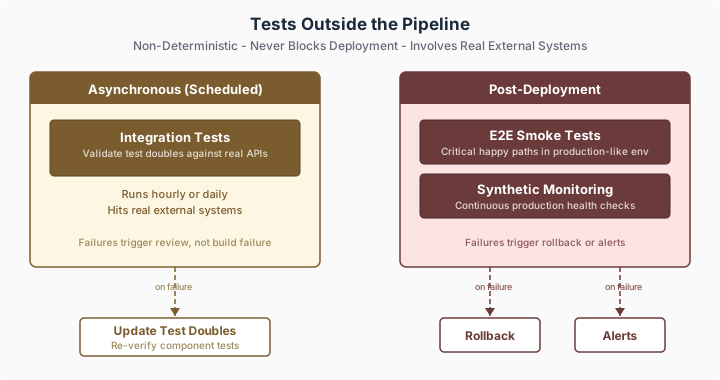
Integration tests validate that contract test doubles still match the real external systems. They run in a dedicated test environment with versioned test data, on demand or on a schedule, providing monitoring rather than gating.
The anti-pattern: the ice cream cone
Most teams that struggle with CD have inverted the pyramid - too many slow, flaky end-to-end tests and too few fast, focused ones. Manual gates block every release. The pipeline cannot give a fast, reliable answer, so deployments become high-ceremony events.
Test Architecture
A test architecture is the deliberate structure of how different test types work together across
your pipeline to give you deployment confidence. Use the table below to decide what type of test
to write and where it runs. This is not a comprehensive list. It shows how common tests impact
pipeline design and how teams should structure their suites. See the
Pipeline Reference Architecture
for a complete quality gate sequence.
The critical insight: everything that blocks merge is deterministic and under your
control. Acceptance tests gate production promotion after verifying the deployed artifact.
Everything that involves real external systems runs post-deployment. This is what gives you
the independence to deploy any time, regardless of the state of the world around you.
Acceptance tests can include non-deterministic activities (load, chaos, resilience), but the
gate decision is still deterministic: it fires on a documented pass/fail threshold - a
performance budget, an error-rate ceiling, a required compliance check - not on the raw
variability of the measurement. That is different from gating on a flaky test whose pass/fail
flips for reasons unrelated to the change, which the Do Not list below warns against.
Pre-merge vs post-merge
The table maps to two distinct phases of your pipeline, each with different goals and
constraints.
Pre-merge (before code lands on trunk): Run unit, component, and contract tests. These must all be
deterministic and fast. Target: under 10 minutes total. This is the quality gate that every
change must pass. If pre-merge tests are slow, developers batch up changes or skip local runs,
both of which undermine continuous integration.
Post-merge (after code lands on trunk, before or after deployment): Re-run the full
deterministic suite against the integrated trunk. Then run acceptance tests, E2E smoke tests, and
synthetic monitoring post-deploy.
Integration tests run separately in a test environment, on demand or on a schedule. Target: under
60 minutes for the full post-merge cycle.
Why re-run pre-merge tests post-merge? Two changes can each pass pre-merge independently but
conflict when combined on trunk. The post-merge run catches these integration effects.
If a post-merge failure occurs, the team fixes it immediately. Trunk must always be releasable.
This post-merge re-run is what teams traditionally call regression testing: running all previous tests against the current artifact to confirm that existing behavior still works after a change. In CD, regression testing is not a separate test type or a special suite. Every test in the pipeline is a regression test. The deterministic suite runs on every commit, and the full suite runs post-merge. A green run means the artifact has been regression-tested against every behavior the suite encodes - no more and no less, which is why the suite’s coverage of prior behavior is what makes the signal trustworthy.
good practices
Do
Run tests on every commit. If tests do not run automatically, they will be skipped.
Keep the deterministic suite under 10 minutes. If it is slower, developers will stop
running it locally.
Fix broken tests immediately. A broken test is equivalent to a broken build.
Delete tests that do not provide value. A test that never fails and tests trivial behavior
is maintenance cost with no benefit.
Test behavior, not implementation. Use a
black box approach - verify what the code
does, not how it does it. As Ham Vocke advises: “if I enter values x and y, will the
result be z?” - not the sequence of internal calls that produce z. Avoid
white box testing that asserts on internals.
Use test doubles for external dependencies. Your deterministic tests should run without
network access to external systems.
Validate test doubles with contract tests. Test doubles that drift from reality give false
confidence.
Treat test code as production code. Give it the same care, review, and refactoring
attention.
Run automated accessibility checks on every commit. WCAG compliance scans are fast,
deterministic, and catch violations that are invisible to sighted developers. Treat them
like security scans: automate the detectable rules and reserve manual review for
subjective judgment. See Accessibility testing
for the full three-tier strategy and pipeline placement.
Do Not
Do not tolerate flaky tests. Quarantine or delete them immediately.
Do not gate your pipeline on flaky, non-deterministic test signals. E2E and integration
test failures - pass/fail that flips for reasons unrelated to the change - should trigger
review or alerts, not block deployment. (An acceptance gate that fires on a deterministic
threshold, like a performance budget, is not this: the gate decision is stable even when the
underlying measurement varies.)
Do not couple your deployment to external system availability. If a third-party API being
down prevents you from deploying, your test architecture has a critical gap.
Do not write tests after the fact as a checkbox exercise. Tests written without
understanding the behavior they verify add noise, not value.
Do not test private methods directly. Test the public interface; private methods are tested
indirectly.
Do not share mutable state between tests. Each test should set up and tear down its own
state.
Do not use sleep/wait for timing-dependent tests. Use explicit waits, polling, or
event-driven assertions.
Do not let unit or component tests depend on a shared or external database or service. A
real engine the team controls and isolates per test - a per-test testcontainer, or a
transaction that rolls back at teardown - is fine in-band and stays deterministic. A
shared, mutable database, or any service the team does not control, is not: that
reintroduces non-determinism, so categorize the test as integration or end-to-end and run it
post-deployment, not as a pre-merge gate.
Do not make exploratory or usability testing a release gate. These activities are
continuous and inform product direction; they are not a pass/fail checkpoint before deployment.
Related Content
ACD - How acceptance criteria make testing the constraint that governs agent-generated code
The principles that determine what belongs in your test suite and what does not - focusing on interfaces, isolating what you control, and applying the same pattern to frontend and backend.
Three principles determine what belongs in your test suite and what does not.
If you cannot fix it, do not test for it
You should never test the behavior of
services you consume. Testing their behavior is the responsibility of the team that builds
them. If their service returns incorrect data, you cannot fix that, so testing for it is
waste.
What you should test is how your system responds when a consumed service is unstable or
unavailable. Can you degrade gracefully? Do you return a meaningful error? Do you retry
appropriately? These are behaviors you own and can fix, so they belong in your test suite.
This principle directly enables the pipeline test strategy. When you stop testing things you
cannot fix, you stop depending on external systems in your pipeline. Your tests become faster,
more deterministic, and more focused on the code your team actually ships.
Test interfaces first
Most integration failures originate at interfaces, the boundaries where your system talks to
other systems. These boundaries are the highest-risk areas in your codebase, and they deserve
the most testing attention. But testing interfaces does not require integrating with the real
system on the other side.
When you test an interface you consume, the question is: “Can I understand the response and
act accordingly?” If you send a request for a user’s information, you do not test that you
get that specific user back. You test that you receive and understand the properties you need -
that your code can parse the response structure and make correct decisions based on it. This
distinction matters because it keeps your tests deterministic and focused on what you control.
Use contract mocks, virtual services, or any
test double that faithfully represents the interface contract. The test validates your side of
the conversation, not theirs.
Frontend and backend follow the same pattern
Both frontend and backend applications provide interfaces to consumers and consume interfaces
from providers. The only difference is the consumer: a frontend provides an interface for
humans, while a backend provides one for machines. The testing strategy is the same.
Test frontend code the same way you test backend code: validate the interface you provide,
test logic in isolation, and verify that user actions trigger the correct behavior. The only
difference is the consumer (a human instead of a machine).
For a frontend:
Validate the interface you provide. The UI contains the components it should and they
appear correctly. This is the equivalent of verifying your API returns the right response
structure.
Test behavior isolated from presentation. Use your unit test framework to test the
logic that UI controls trigger, separated from the rendering layer. This gives you the same
speed and control you get from testing backend logic in isolation.
Verify that controls trigger the right logic. Confirm that user actions invoke the
correct behavior, without needing a running backend or browser-based E2E test.
This approach gives you targeted testing with far more control. Testing exception flows -
what happens when a service returns an error, when a network request times out, when data is
malformed, becomes straightforward instead of requiring elaborate E2E setups that are hard
to make fail on demand.
Test Quality Over Coverage Percentage
Code coverage tells you which lines executed during tests. It does not tell you whether the tests
verified anything meaningful. A test suite with 90% coverage and no assertions has high coverage
and zero value.
Better questions than “what is our coverage percentage?”:
When a test fails, does it point directly to the defect?
When we refactor, do tests break because behavior changed or because implementation details
shifted?
Do our tests catch the bugs that actually reach production?
Can a developer trust a green build enough to deploy immediately?
Why coverage mandates are harmful
When teams are required to hit a coverage target, they
write tests to satisfy the metric rather than to verify behavior. This produces:
Tests that exercise code paths without asserting outcomes
Tests that mirror implementation rather than specify behavior
Tests that inflate the number without improving confidence
The metric goes up while the defect escape rate stays the same. Worse, meaningless tests add
maintenance cost and slow down the suite.
Instead of mandating a coverage number, set a coverage floor (see
Getting Started)
and focus team attention on test quality: mutation testing scores, defect escape rates, and
whether developers actually trust the suite enough to deploy on green.
Test Doubles - Patterns for isolating dependencies in tests
Contract Tests - Verifying that test doubles match reality
3.3 - Pipeline Test Strategy
What tests run where in a CD pipeline, how contract tests validate the test doubles used inside the pipeline, and why everything that blocks deployment must be deterministic.
Everything that blocks deployment must be deterministic and under your control. Everything
that involves external systems runs asynchronously or post-deployment. This gives you the
independence to deploy any time, regardless of the state of the world around you.
Tests Inside the Pipeline
These tests run on every commit and block deployment if they fail. They must be fast,
deterministic, and free of external dependencies.
Every test in this pipeline uses test doubles for
anything that crosses the component boundary into a system the team does not control: third-party
APIs, downstream services owned by other teams, message brokers. No in-band test calls a shared
or external service. A real engine the team owns and isolates per test - a database in a per-test
testcontainer, for example - is permitted in-band because it stays deterministic. This means:
A downstream outage cannot block your deployment. Your pipeline runs the same whether
external systems are healthy or down.
Tests are deterministic. The same code always produces the same result.
The suite is fast. No network latency, no waiting for external systems to respond.
Why re-run tests post-merge?
Two changes can each pass pre-merge independently but conflict when combined on trunk. The
post-merge run catches these integration effects. If a post-merge failure occurs, the team
fixes it immediately. Trunk must always be releasable.
Tests Outside the Pipeline
These tests involve real external systems and are therefore non-deterministic. They never
block deployment. Instead, they validate assumptions and monitor production health.
Test Type
When It Runs
What It Does on Failure
Contract tests
On a schedule (hourly or daily)
Triggers review; team updates test doubles to match new reality
The pipeline’s deterministic tests depend on test doubles to represent external systems. But
test doubles can drift from reality. An API adds a required field, changes a response format,
or deprecates an endpoint. Contract tests close this gap.
Pipeline tests use test doubles that encode your assumptions about external APIs -
response schemas, status codes, error formats.
Contract tests run on a schedule and send real requests to the actual external APIs.
Contract tests compare the real response against what your test doubles return. They
check structure and types, not specific data values.
When a contract test passes, your test doubles are confirmed accurate. The pipeline’s
deterministic tests are trustworthy.
When a contract test fails, the team is alerted. They update the test doubles to match
the new reality, then re-run component tests to verify nothing breaks.
This design means your pipeline never touches external systems, but you still catch when
external systems change. You get both speed and accuracy.
Consumer-driven contracts
When the external API is owned by another team in your organization, you can go further with
consumer-driven contracts. Instead of your team polling their API on a schedule, both teams
share a contract specification (using a tool like Pact):
You (the consumer) define the requests you send and the responses you expect.
They (the provider) run your contract as part of their build. If a change would break
your expectations, their build fails before they deploy.
Your test doubles are generated from the contract, guaranteeing they match what the
provider actually delivers.
This shifts contract validation from “detect and react” to “prevent.” See
Contract Tests for implementation details.
Summary: All Stages at a Glance
Stage
Blocks Deployment?
Uses Test Doubles?
Deterministic?
Every Commit
Yes
Yes - all external deps
Yes
Post-Merge
Yes
Yes - all external deps
Yes
Scheduled (Contract)
No - triggers review
No - hits real APIs
No
Post-Deploy (E2E)
No - triggers rollback
No - real system
No
Production (Monitoring)
No - triggers alerts
No - real system
No
The Testing reference provides detailed documentation
for each test type, including code examples and anti-patterns.
Practical steps to audit your test suite, fix flaky tests, decouple from external dependencies, and adopt test-driven development.
Starting Without Full Coverage
Teams often delay adopting CI because their existing code lacks tests. This is backwards. You do
not need tests for existing code to begin. You need one rule applied without exception:
Every new change gets a test. We will not go lower than the current level of code coverage.
Record your current coverage percentage as a baseline. Configure CI to fail if coverage drops
below that number. This does not mean the baseline is good enough. It means the trend only moves
in one direction. Every bug fix, every new feature, and every refactoring adds tests. Over time,
coverage grows organically in the areas that matter most: the code that is actively changing.
Do not attempt to retrofit tests across the entire codebase before starting CI. That approach
takes months and delivers no incremental value. It also produces low-quality tests written by
developers who are testing code they did not write and do not fully understand.
Quick-Start Action Plan
If your test suite is not yet ready to support CD, use this focused action plan to make immediate
progress.
1. Audit your current test suite
Assess where you stand before making changes.
Actions:
Run your full test suite 3 times. Note total duration and any tests that pass intermittently
(flaky tests).
Count tests by type: unit, integration, functional, end-to-end.
Identify tests that require external dependencies (databases, APIs, file systems) to run.
Record your baseline: total test count, pass rate, duration, flaky test count.
Map each test type to a pipeline stage. Which tests gate deployment? Which run asynchronously?
Which tests couple your deployment to external systems?
Output: A clear picture of your test distribution and the specific problems to address.
2. Fix or remove flaky tests
Flaky tests are worse than no tests. They train developers to ignore failures, which means real
failures also get ignored.
Actions:
Quarantine all flaky tests immediately. Move them to a separate suite that does not block the
build.
For each quarantined test, decide: fix it (if the behavior it tests matters) or delete it (if
it does not).
Common causes of flakiness: timing dependencies, shared mutable state, reliance on external
services, test order dependencies.
Target: zero flaky tests in your main test suite.
3. Decouple your pipeline from external dependencies
This is the highest-leverage change for CD. Identify every test that calls a real external service
and replace that dependency with a test double.
Actions:
List every external service your tests depend on: databases, APIs, message queues, file
storage, third-party services.
For each dependency, decide the right test double approach:
In-memory fakes for databases (e.g., an in-memory repository, or SQLite/H2 standing in
for the production engine). Fastest, but they do not exercise real SQL semantics.
A team-controlled real engine in a per-test testcontainer when the production query
plan, constraints, or migrations matter. This is a real database, not a fake, but it stays
deterministic because the team pins the version and isolates state per test, so it runs
in-band.
HTTP stubs for external APIs the team does not control (e.g., WireMock, nock, MSW).
Fakes for message queues, email services, and other infrastructure.
Replace the dependencies in your unit and component tests.
Move the original tests that hit real services into a separate suite. These become your
starting contract tests or E2E smoke tests.
Output: A test suite where everything that blocks the build is deterministic and runs without
network access to external systems.
4. Add component tests for critical paths
If you do not have component tests that exercise your whole service in
isolation, start with the most critical paths.
Actions:
Identify the 3-5 most critical user journeys or API endpoints in your application.
Write a component test for each: boot the application, stub external dependencies, send a
real request or simulate a real user action, verify the response.
Each component test should prove that the feature works correctly assuming external
dependencies behave as expected (which your test doubles encode).
Run these in CI on every commit.
Output: Component tests covering your critical paths, running in CI on every commit.
5. Set up contract tests for your most important dependency
Pick the external dependency that changes most frequently or has caused the most production
issues. Set up a contract test for it.
Actions:
Write a contract test that validates the response structure (types, required fields, status
codes) of the dependency’s API.
Run it on a schedule (e.g., every hour or daily), not on every commit.
When it fails, update your test doubles to match the new reality and re-verify your
component tests.
If the dependency is owned by another team in your organization, explore consumer-driven
contracts with a tool like Pact.
Output: One contract test running on a schedule, with a process to update test doubles when it fails.
6. Adopt TDD for new code
Once your pipeline tests are reliable, adopt TDD for all new work. TDD is the practice of writing the test before the code. It ensures every
piece of behavior has a corresponding test.
The TDD cycle
Red: Write a failing test that describes the behavior you want.
Green: Write the minimum code to make the test pass.
Refactor: Improve the code without changing the behavior. The test ensures you do not
break anything.
Why TDD matters for CD
Every change is automatically covered by a test
The test suite grows proportionally with the codebase
Tests describe behavior, not implementation, making them more resilient to refactoring
Developers get immediate feedback on whether their change works
TDD is not mandatory for CD, but teams that practice TDD consistently have significantly faster
and more reliable test suites.
How to start: Pick one new feature or bug fix this week. Write the test first, watch it
fail, write the code to make it pass, then refactor. Do not try to retroactively TDD your
entire codebase. Apply TDD to new code and to any code you modify.
Output: Team members practicing TDD on new work, with at least one completed red-green-refactor cycle.
How to trace defects to their origin and make systemic changes that prevent entire categories of bugs from recurring.
Treat every test failure as diagnostic data about where your process breaks down, not just as
something to fix. When you identify the systemic source of defects, you can prevent entire
categories from recurring.
Two questions sharpen this thinking:
What is the earliest point we can detect this defect? The later a defect is found, the
more expensive it is to fix. A requirements defect caught during example mapping costs
minutes. The same defect caught in production costs days of incident response, rollback,
and rework.
Can AI help us detect it earlier? AI-assisted tools can now surface defects at stages
where only human review was previously possible, shifting detection left without adding
manual effort.
Trace Every Defect to Its Origin
When a test catches a defect (or worse, when a defect escapes to production) ask: where was
this defect introduced, and what would have prevented it from being created?
Defects do not originate randomly. They cluster around specific causes. The
CD Defect Detection and Remediation Catalog
documents over 30 defect types across eight categories, with detection methods, AI
opportunities, and systemic fixes for each.
Category
Example Defects
Earliest Detection
Systemic Fix
Requirements
Building the right thing wrong, or the wrong thing right
Discovery, during story refinement or example mapping
Acceptance criteria as user outcomes, Three Amigos sessions, example mapping
Missing domain knowledge
Business rules encoded incorrectly, tribal knowledge loss
During coding, when the developer writes the logic
Ubiquitous language (DDD), pair programming, rotate ownership
Integration boundaries
Interface mismatches, wrong assumptions about upstream behavior
During design, when defining the interface contract
Contract tests per boundary, API-first design, circuit breakers
Untested edge cases
Null handling, boundary values, error paths
Pre-commit, through null-safe type systems and static analysis
Property-based testing, boundary value analysis, test for every bug fix
Pre-commit for null safety; CI for schema compatibility
Null-safe types, expand-then-contract for schema changes, design for idempotency
For the complete catalog covering all defect categories (including product and discovery,
dependency and infrastructure, testing and observability gaps, and more) see the
CD Defect Detection and Remediation Catalog.
Build a Defect Feedback Loop
You need a process that systematically connects test
failures to root causes and root causes to systemic fixes.
Classify every defect. When a test fails or a bug is reported, tag it with its origin
category from the tables above. This takes seconds and builds a dataset over time.
Look for patterns. Monthly (or during retrospectives), review the defect
classifications. Which categories appear most often? That is where your process is weakest.
Apply the systemic fix, not just the local fix. When you fix a bug, also ask: what
systemic change would prevent this entire category of bug? If most defects come from
integration boundaries, the fix is not “write more integration tests.” It is “make contract
tests mandatory for every new boundary.” If most defects come from untested edge cases, the
fix is not “increase code coverage.” It is “adopt property-based testing as a standard
practice.”
Measure whether the fix works. Track defect counts by category over time. If you
applied a systemic fix for integration boundary defects and the count does not drop, the fix
is not working and you need a different approach.
The Test-for-Every-Bug-Fix Rule
Every bug fix must include a test that reproduces the bug before the fix and passes after.
This is non-negotiable for CD because:
It proves the fix actually addresses the defect (not just the symptom).
It prevents the same defect from recurring.
It builds test coverage exactly where the codebase is weakest: the places where bugs actually
occur.
Over time, it shifts your test suite from “tests we thought to write” to “tests that cover
real failure modes.”
Advanced Detection Techniques
As your test architecture matures, add techniques that catch defects before manual review:
Technique
What It Finds
When to Adopt
Mutation testing (Stryker, PIT)
Tests that pass but do not actually verify behavior (your test suite’s blind spots)
When basic coverage is in place but defect escape rate is not dropping
Property-based testing
Edge cases and boundary conditions across large input spaces that example-based tests miss
When defects cluster around unexpected input combinations
Chaos engineering
Failure modes in distributed systems: what happens when a dependency is slow, returns errors, or disappears
When you have component tests and contract tests in place and need confidence in failure handling
Static analysis and linting
Null safety violations, type errors, security vulnerabilities, dead code
Definitions of the test types used throughout this site.
Definitions for the test types used throughout this site. Each page covers what the type is, when it runs in the pipeline, what it asserts on, and what it does not.
The list isn’t exhaustive and the boundaries between types aren’t crisp in every codebase. Use these definitions as shared vocabulary for the rest of the testing section, especially Applied Testing Strategies and Testing Antipatterns.
3.6.1 - Component Tests
Deterministic tests that exercise a single component through its public interface, with systems the team doesn’t control replaced by test doubles.
Definition
Verification of a coherent structural unit (such as an entire microservice, UI component, or self-contained subsystem) against its specific contract and internal logic, while keeping interactions beyond that component’s boundary mocked or stubbed.
Scope & Boundaries
Broader than a unit test, but strictly narrower than an end-to-end (E2E) integration test. It tests the interplay of multiple internal classes/modules working together within that component. Out-of-process network calls and external downstream services are replaced by API wire-level stubs or in-memory equivalents (e.g., WireMock, MSW, ephemeral test containers).
Core Characteristics
Validates state management, internal workflows, data transformations, and edge-to-edge behavior within a bounded context without taking dependencies on third-party uptime or network latency.
Good Practices
Mock only at boundary borders: Exercise the component’s internal routing, controllers, domain models, and data mappers together; only mock external HTTP APIs, message brokers, or remote databases.
Use ephemeral infrastructure: Use fast, disposable local resources (e.g., local SQLite/Postgres in Docker, local WireMock) to mirror real component runtime characteristics.
Versioned, repeatable test data.
Verify contract-to-state workflows: Validate that boundary inputs result in the correct local state changes and expected outgoing network payloads.
Anti-Patterns
E2E scope creep: Allowing the test to call live third-party services or dependent microservices instead of wire-level stubs.
Re-testing granular unit logic: Writing dozens of micro-permutations of input edge cases at the component level instead of covering them in fast unit tests.
Leaky test harness state: Failing to purge in-memory databases or reset wire stubs between runs, leading to non-deterministic test flakiness.
When to Avoid
They overlap heavily with other layers when the component is:
Thin CRUD with no middleware to speak of. Provider contract verification against a booted app plus sociable unit tests of the domain cover most of what a component test would. Keep one per critical flow as smoke coverage; skip exhaustive component coverage.
Utility libraries are effectively multiple small components in as a single consumable dependency.
Pure transformation logic. Parsers, calculators, scheduling math. Unit tests give better coverage per unit of effort.
If you’re choosing between an extra component test and an extra unit test for the same behavior, the unit test is cheaper to write, run, and maintain. Component tests earn their keep at the seams between layers, not in repeating ground that unit tests already cover.
Examples
Backend Service
A component test for a REST API, exercising the full application stack with the
downstream inventory service replaced by a test double:
Backend component test - order creation with stubbed inventory service
describe("POST /orders",()=>{it("should create an order and return 201",async()=>{// Arrange: mock the inventory service responsehttpMock("https://inventory.internal").onGet("/stock/item-42").reply(200,{available:true,quantity:10});// Act: send a request through the full application stackconst response =awaitrequest(app).post("/orders").send({itemId:"item-42",quantity:2});// Assert: verify the public interface responseexpect(response.status).toBe(201);expect(response.body.orderId).toBeDefined();expect(response.body.status).toBe("confirmed");});it("should return 409 when inventory is insufficient",async()=>{httpMock("https://inventory.internal").onGet("/stock/item-42").reply(200,{available:true,quantity:0});const response =awaitrequest(app).post("/orders").send({itemId:"item-42",quantity:2});expect(response.status).toBe(409);expect(response.body.error).toMatch(/insufficient/i);});});
Frontend Component
A component test exercising a login flow with a stubbed authentication service:
Frontend component test - login flow with stubbed auth service
describe("Login page",()=>{it("should redirect to the dashboard after successful login",async()=>{
mockAuthService.login.mockResolvedValue({token:"abc123"});render(<App />);await userEvent.type(screen.getByLabelText("Email"),"ada@example.com");await userEvent.type(screen.getByLabelText("Password"),"s3cret");await userEvent.click(screen.getByRole("button",{name:"Sign in"}));expect(await screen.findByText("Dashboard")).toBeInTheDocument();});});
Accessibility Verification
Component tests already exercise the UI from the actor’s perspective, making them the
natural place to verify that interactions work for all users. Accessibility assertions
fit alongside existing assertions rather than in a separate test suite.
This is the second of three tiers in the
Accessibility testing
strategy: static-analysis linting catches structural violations in source, component tests catch
the rendered-only ones (computed contrast, focus order, keyboard operability), and manual audits
cover the subjective remainder.
Accessibility component test - keyboard navigation and WCAG assertions
// accessibility scanner setupdescribe("Checkout flow",()=>{it("should be completable using only the keyboard",async()=>{render(<CheckoutPage />);await userEvent.tab();expect(screen.getByLabelText("Card number")).toHaveFocus();await userEvent.type(screen.getByLabelText("Card number"),"4111111111111111");await userEvent.tab();await userEvent.type(screen.getByLabelText("Expiry"),"12/27");await userEvent.tab();await userEvent.keyboard("{Enter}");expect(await screen.findByText("Order confirmed")).toBeInTheDocument();const results =awaitaccessibilityScanner(document.body);expect(results).toHaveNoViolations();});});
Connection to CD Pipeline
Component tests run after unit tests in the pipeline, but before longer running acceptance tests, and provide the broadest fast,
deterministic feedback:
Local development: run before committing. Deterministic scope keeps them fast
enough to run locally without slowing the development loop.
PR verification: CI executes the full suite; failures block merge.
Trunk verification: the same tests run on the merged HEAD to catch conflicts.
They should always halt the CD pipeline on failure.
3.6.2 - Contract Tests
Deterministic tests that verify interface boundaries with external systems using test doubles. Also called narrow integration tests. Validated by integration tests running against real systems.
Definition
Verification that two separate systems (such as an API provider and its consumers, or a message publisher and subscriber) adhere to a shared, agreed-upon formal specification, the “contract”, without requiring both services to run simultaneously in an integrated environment.
Scope & Boundaries
Targets only the boundary interface: request payloads, query parameters, HTTP headers, response schemas, status codes, or message formats. It does not test internal business logic, database state, or deep end-to-end user journeys; it solely verifies compatibility with the interface schema (e.g., OpenAPI/Swagger, AsyncAPI, Protobuf).
Characteristics
Fast, independent execution across pipelines, prevents breaking schema changes before deployment, and eliminates the need for expensive, flaky end-to-end integration environments in applications with proper domain separation.
Good Practices:
Strict schema adherence: Explicitly define nullability, enums, required fields, and format constraints rather than relying on loose, open schemas.
Automated breaking-change detection: Integrate tools like oasdiff or buf breaking into CI to catch backwards-incompatible schema changes on pull requests.
Generate stubs directly from contracts: Use contract-driven mock engines (e.g., Prism, Microcks) so mock behavior automatically updates whenever the contract changes.
Anti-Patterns:
Testing business logic via contracts: Attempting to verify authorization rules, complex workflows, or algorithmic computations inside a contract test.
Example: testing that a request for a user return a specific user instead of the expected user object.
Hand-crafted, unverified mock fixtures: Manually updating JSON response stubs in consumer code repos without validating them against the live contract artifact.
All-or-nothing megaspecs: Coupling unrelated domains or multiple service interfaces into a single monolithic contract document that cannot be versioned or evolved independently.
Validating the Contract
A contract test only proves your code matches the contract - not that the contract still matches the real system. Integration tests close that gap by running against the real dependency. How tightly that loop closes depends on collaboration level: low collaboration means scheduled integration tests against the real system with no shared tooling; high collaboration adds a hosted specification server (Pact, Pacto), a specification fetched from a shared or provider repository at build time, or a provider webhook that triggers the consumer’s CI when the contract changes.
Consumer and Provider Perspectives
A contract has two sides asking different questions. The consumer asks whether the fields, types, and status codes it depends on still exist. Consumer tests assert only on the subset of the API the consumer actually uses, not the whole response - following Postel’s Law, be liberal in what you accept and conservative in what you send.
The provider asks whether its changes will break any consumer. A provider test runs every published consumer expectation against the real implementation, catching a removed field, a changed type, or altered error behavior before a consumer deploys and discovers the break.
Contract-First Development
The interface is defined as a formal artifact - an OpenAPI, Protobuf, or AsyncAPI spec - before either side writes an implementation. Consumer and provider teams build independently against that artifact, then verify conformance to the spec rather than to each other’s code. Works best for new APIs and parallel development, where there’s no existing implementation to write consumer-driven contracts against.
Examples
A consumer contract test using a consumer-driven contract tool:
Consumer contract test - order service consuming inventory API
describe("Order Service - Inventory Provider Contract",()=>{it("should receive stock availability in the expected format",async()=>{// Define what the consumer expects from the providerawait contractTool.addInteraction({state:"item-42 is in stock",uponReceiving:"a request for item-42 stock",withRequest:{method:"GET",path:"/stock/item-42"},willRespondWith:{status:200,body:{// Only assert on fields the consumer actually usesavailable:matchType(true),// booleanquantity:matchType(10),// integer},},});// Exercise the consumer code against the mock providerconst result =await inventoryClient.checkStock("item-42");expect(result.available).toBe(true);});});
A provider verification test that runs consumer expectations against the real implementation:
Provider verification - running consumer contracts against the real API
describe("Inventory Service - Provider Verification",()=>{it("should satisfy all registered consumer contracts",async()=>{await contractBroker.verifyProvider({provider:"InventoryService",providerBaseUrl:"http://localhost:3001",brokerUrl:"https://contract-broker.internal",providerVersion: process.env.GIT_SHA,});});});
A contract-first schema validation test verifying a provider response against an OpenAPI spec:
Contract-first test - OpenAPI schema validation
// The OpenAPI document is the source of truth. Validate the whole response// against the named schema rather than hand-checking individual fields - a// field-by-field check drifts from the spec the moment the spec changes.const validator =openApiValidator(openApiSpec);describe("GET /stock/:id - OpenAPI contract",()=>{it("should return a response conforming to the published schema",async()=>{const response =awaitfetch("http://localhost:3001/stock/item-42");const body =await response.json();expect(response.status).toBe(200);// Asserts structure, types, required fields, and additionalProperties// rules exactly as the OpenAPI schema declares them.const result = validator.validate(body,"StockResponse");expect(result.errors).toEqual([]);});});
Connection to CD Pipeline
Contract tests run after unit tests in the pipeline:
Local development: run before committing. Deterministic scope keeps them fast
enough to run locally without slowing the development loop.
PR verification: CI executes the full suite; failures block merge.
Trunk verification: the same tests run on the merged HEAD to catch conflicts.
They should always halt the CD pipeline on failure.
3.6.3 - End-to-End Tests
Tests that exercise two or more real components up to the full system. Non-deterministic by nature; never a pre-merge gate.
Definition
Verification of a complete end-to-end user or business transaction through the entire deployed application stack, matching the perspective and experience of an actual user or external consumer.
Scope & Boundaries
Encompasses the entire system topology—from the frontend UI or external API gateway through all internal microservices, asynchronous workers, live queues, databases, and necessary third-party sandbox integrations.
Core Characteristics
Highest real-world confidence, highest execution cost, slowest run time, and highest vulnerability to environment or network-induced flakiness.
Good Practices
Restrict to critical revenue/operational paths: Focus E2E coverage strictly on non-negotiable user journeys (e.g., user registration, primary checkout, key ingest pipelines).
Automate environment provisioning: Deploy ephemeral, on-demand preview environments to run E2E suites and tear them down immediately upon completion.
Implement resilient element selection: Select UI elements using accessibility roles or stable data attributes (e.g., data-testid) rather than fragile CSS classes or absolute XPath selectors.
Anti-Patterns
Using E2E tests for regression safety nets: Relying on E2E suites to catch regressions that could have been detected upstream in unit, component, or contract stages (the “inverted testing pyramid”).
Arbitrary thread sleeps: Adding fixed pauses (e.g., sleep(5)) to wait for asynchronous events rather than using explicit, condition-driven polling.
Accepting flaky tests: Rerunning failing E2E tests until they turn green rather than quarantining and fixing the underlying timing or state issues immediately.
Weaknesses & Challenges
High Flakiness and Low Signal-to-Noise Ratio: Non-deterministic failures are common. Network blips, browser rendering lag, race conditions in asynchronous frontend frameworks, and transient third-party service outages often cause false-negative test failures that erode developer trust.
Poor Root-Cause Localization: When an E2E test fails with a generic error (e.g., TimeoutError: Element #confirmation-banner not found), finding the source of the issue requires combing through client logs, gateway routes, backend microservice traces, and database state to determine what actually broke.
Environment Maintenance & Resource Cost: E2E suites typically demand fully integrated staging or preview environments. Keeping these environments populated with realistic test data, configured with active credentials, and synchronized across dozens of microservices is notoriously resource-intensive.
Prohibitive Execution Times: Running full browser automation or multi-service distributed flows can take anywhere from tens of minutes to several hours. This latency breaks continuous delivery flow, encouraging teams to defer testing to late-stage, batch-processed pipelines rather than getting instant feedback on change.
Tight Coupling to Volatile UI/API Layouts: Small cosmetic changes (like modifying class names, reordering markup, or tweaking a multi-step user flow) often break brittle E2E tests even though the underlying business capability remains completely functional.
Examples
Example (Playwright UI / Full System Flow)
import{ test, expect }from'@playwright/test';test('user can complete entire purchase flow',async({ page })=>{// Navigates real UI against a fully deployed environmentawait page.goto('https://checkout.staging.example.com');await page.fill('#username','test_user');await page.fill('#password','SecurePass123!');await page.click('button[type="submit"]');// Add item to cart and initiate purchaseawait page.click('button[data-item="product-42"]');await page.click('#cart-checkout');await page.fill('#card-element','4242424242424242');await page.click('#submit-payment');// Confirms response propagated across API, async billing, and UI renderingawaitexpect(page.locator('.order-confirmation')).toHaveText(/Order #\d+ Confirmed/);});
When to Use / Avoid
Use them for:
Happy-path validation of critical business flows that cannot be verified any
other way (e.g., a payment flow that depends on a real payment provider).
Entangled domain workflows that span multiple deployables and cannot be isolated
within a single component test.
They are the most expensive test type to write, run, and maintain. Use them sparingly.
Avoid for:
Edge cases, error handling, or input validation. Those scenarios belong in unit or
component tests.
Connection to CD Pipeline
E2E tests should only run in the pipeline as part of the longer running acceptance tests if they can be made dependable and deterministic. Otherwise, they should be run on a schedule and not act as a delivery decision.
3.6.4 - Integration Tests
Tests that exercise real external dependencies to validate that contract test doubles still match reality. Non-deterministic; never a pre-merge gate.
Definition
Verification that two or more distinct architectural subsystems or external dependencies interact correctly across their transport layer and data boundaries.
Scope & Boundaries
Broader than a component test because it explicitly validates communication with real external systems (such as a database, message queue, cache, or filesystem), but narrower than a full end-to-end test because it targets a specific integration boundary rather than complete multi-service user workflows.
Core Characteristics
Detects driver/dialect mismatches, schema serialization issues, connection pooling misconfigurations, and ORM/SQL query errors that mock-heavy tests overlook.
Good Practices
Use disposable, ephemeral infrastructure: Spin up real databases and queues using container tooling (e.g., Testcontainers) rather than using shared, persistent static environments.
Verify transport-level error handling: Intentionally test connection timeouts, pool exhaustion, network blips, and transaction rollbacks.
Run tests against clean boundary state: Truncate tables, flush caches, and clear queues between test runs to guarantee deterministic execution.
Anti-Patterns
Using shared remote environments: Pointing integration test suites to shared dev/staging databases, causing data collisions and race conditions between concurrent CI jobs.
Testing business permutations: Testing dozens of conditional logic branches through real databases instead of pushing that logic down to fast unit tests or leveraging component tests.
Ignoring production parity: Testing against an SQLite in-memory database locally when production runs Postgres, masking dialect, constraint, and indexing differences.
Weaknesses & Challenges
Infrastructure Orchestration Overhead: Requires managing real databases, message brokers, and caches inside the test execution context. Maintaining container definitions (e.g., Docker/Testcontainers) and keeping schema migrations up to date adds operational burden to developers.
Test Isolation and State Contamination: When tests write real rows to a database or publish messages to an active broker, dirty state from one test can bleed into another. Cleaning, truncating, or rolling back transactions between runs adds latency and complexity.
Slow Pipeline Feedback Cycles: Because integration tests involve real I/O, network socket handshakes, and disk writes, they are orders of magnitude slower than in-memory unit tests. Over-relying on them severely bloats commit-stage feedback loops.
Local vs. Production Discrepancies: Test-specific database configurations, lightweight containerized replicas, or local mocks often mask subtle production issues—such as database clustering behavior, regional latency, connection pool limits, or privilege boundaries.
Examples
Python Example (Repository-to-Database Integration):
import pytest
from sqlalchemy import create_engine
from myapp.storage import OrderRepository, Order
# Runs against an actual ephemeral Postgres container, not an in-memory mock
def test_order_repository_persists_and_retrieves_roundtrip(real_pg_session):
repo =OrderRepository(session=real_pg_session)
new_order =Order(order_id=101, customer_id="cust_abc", total=49.99)
repo.save(new_order)
retrieved = repo.find_by_id(101)
assert retrieved is not None
assert retrieved.customer_id =="cust_abc"
assert retrieved.total ==49.99
Connection to CD Pipeline
Integration tests should only run in the pipeline as part of the longer running acceptance tests if they can be made dependable and deterministic. Otherwise, they should be run on a schedule and not act as a delivery decision.
3.6.5 - Static Analysis
Code analysis tools that evaluate non-running code for security vulnerabilities, complexity, and best practice violations.
Definition
Static analysis (also called static testing) evaluates non-running code against rules for known good practices, inspecting source, configuration, and dependency manifests to catch errors, complexity, and security issues before the code ever runs.
Scope & Boundaries
Analysis runs against source code, configuration files, and dependency manifests at rest - no application starts and no test doubles are needed. Scope is the entire codebase, not a single unit, component, or transaction.
Characteristics
Seconds-scale execution (the fastest test category), fully deterministic, and codebase-wide scope, with no external dependencies except the network calls a dependency scanner makes to a vulnerability database.
Good Practices
Run it everywhere feedback is possible: IDE plugins, pre-commit hooks, and CI each catch issues before the next stage makes them more expensive to fix.
Customize the ruleset: default rules are a starting point; add rules for patterns that keep coming up in code review.
Enforce it as a gate: treat lint, type, and security findings as build-breaking, the same as a failing test.
Anti-Patterns
Disabling rules instead of fixing code: suppressing linter warnings or ignoring security findings erodes the value of static analysis over time.
Skipping ruleset customization: default rules are a starting point, not a ceiling, for patterns specific to the codebase.
Running static analysis only in CI: by the time CI reports a formatting error, the developer has context-switched; IDE and pre-commit feedback catch it sooner.
Ignoring dependency vulnerabilities: known CVEs in dependencies are a direct attack vector and should break the build.
Treating static analysis as optional: if developers can bypass the checks, they will.
When to Run It
In the IDE: real-time feedback as developers type, via editor plugins and language
server integrations.
On save: format-on-save and lint-on-save catch issues immediately.
Pre-commit: hooks prevent problematic code from entering version control.
In CI: the full suite of static checks runs on every PR and on the trunk after
merge, verifying that earlier local checks were not bypassed.
Static analysis is always applicable. Every project, regardless of language or platform,
benefits from linting, formatting, and dependency scanning.
Examples
Linting
A .eslintrc.json configuration enforcing test quality rules:
Statically typed languages catch type mismatches at compile time, eliminating entire classes
of runtime errors. Java, for example, rejects incompatible argument types before the code runs:
Java type checking example
publicstaticdoublecalculateTotal(double price,int quantity){return price * quantity;}// Compiler error: incompatible types: String cannot be converted to doublecalculateTotal("19.99",3);
Dependency Scanning
Dependency scanning tools scan for known vulnerabilities:
npm audit output example
$ npm audit
found 2 vulnerabilities (1 moderate, 1 high)
moderate: Prototype Pollution in lodash <4.17.21
high: Remote Code Execution in log4j <2.17.1
Flags overly deep or long code blocks that breed defects
Type checking
Prevents type-related bugs, replacing some unit tests
Security scanning
Detects known vulnerabilities and dangerous coding patterns
Dependency scanning
Checks for outdated, hijacked, or insecurely licensed deps
Accessibility linting
Detects missing alt text, ARIA violations, contrast failures, semantic HTML issues
Accessibility Linting
Accessibility linting catches deterministic WCAG violations the same way a security scanner
catches known vulnerability patterns. Automated checks cover structural issues (missing alt
text, invalid ARIA attributes, insufficient contrast ratios, broken heading hierarchy) while
manual review covers subjective aspects like whether alt text is actually meaningful.
Linting is the first of three tiers. For how it fits with component-test DOM scans and manual
audits across the pipeline - and the caveat that automated checks catch only a fraction of WCAG
criteria - see Accessibility testing.
An accessibility checker configuration running WCAG 2.1 AA checks against rendered pages:
Accessibility checker configuration for WCAG 2.1 AA
An accessibility scanner test asserting that a rendered component has no violations:
Accessibility scanner test verifying no WCAG violations
// accessibility scanner setup (e.g. import scanner and extend assertions)it("should have no accessibility violations",async()=>{const{ container }=render(<LoginForm />);const results =awaitaccessibilityScanner(container);expect(results).toHaveNoViolations();});
Connection to CD Pipeline
Static analysis is the first gate in the CDpipeline, providing the fastest feedback:
IDE / local development: plugins run in real time as code is written.
Pre-commit: hooks run linters, formatters, and accessibility checks on changed
components, blocking commits that violate rules.
PR verification: CI runs the full static analysis suite (linting, type checking,
security scanning, dependency auditing, accessibility linting) and blocks merge on
failure.
Trunk verification: the same checks re-run on the merged HEAD to catch anything
missed.
Scheduled scans: dependency and security scanners run on a schedule to catch newly
disclosed vulnerabilities in existing dependencies.
Because it requires no running code and no external dependencies, static analysis is the cheapest, fastest gate. A mature CD pipeline treats its failures like any other test failure: they break the build.
3.6.6 - Smoke Tests
A lightweight, automated verification run executed immediately after code is deployed
Definition
A lightweight, automated verification run executed immediately after code is deployed to a live target environment (staging, pre-production, or production) to verify that the environment is healthy, operational, and capable of handling traffic before fully shifting user load.
Scope & Boundaries
Strictly limited to high-level system vitality. It checks that critical infrastructure components (processes, routing, database connectivity, secret access, core endpoints) are alive and reachable. It explicitly avoids deep workflow testing, exhaustive edge-case permutations, or long-running operational flows.
Core Characteristics
Fast (seconds to 2–3 minutes max), strictly non-destructive/read-only, high criticality, and directly tied to deployment orchestration (triggers immediate automated rollback or stops traffic migration if it fails).
Examples
Python API Smoke Test Script
import requests
import sys
BASE_URL="https://checkout.internal.net"
def run_smoke():
# 1. Deep health check(probes DB connection, cache, and queue availability)
health = requests.get(f"{BASE_URL}/healthz/ready", timeout=5)
assert health.status_code ==200, f"Health check failed: {health.text}"
assert health.json().get("database")=="UP"
# 2. Key static config / version check
version = requests.get(f"{BASE_URL}/version", timeout=3)
assert version.status_code ==200
assert version.json().get("commit_sha")== sys.argv[1]
# 3. Non-destructive read query against a core endpoint
catalog = requests.get(f"{BASE_URL}/api/v1/products/featured", timeout=5)
assert catalog.status_code ==200
assert len(catalog.json())>0if __name__ =="__main__":run_smoke()
A Java sociable unit test exercising real domain logic through its public interface. The
collaborators (the pricing policy and the order model) are real objects, not mocks, and the test
asserts on the observable outcome - the computed total - rather than on which methods were called:
Java sociable unit test for a bulk-discount pricing rule
@TestpublicvoidappliesBulkDiscountWhenQuantityReachesThreshold(){// Arrange: real collaborators, no test doubles - this is pure in-process logicPricingPolicy pricing =newPricingPolicy(bulkThreshold(10),bulkDiscountRate(0.15));Order order =newOrder(newLineItem("widget",money("20.00"),quantity(12)));// ActMoney total = pricing.totalFor(order);// Assert: the observable result, not the sequence of internal calls// 12 * 20.00 = 240.00, less 15% = 204.00assertEquals(money("204.00"), total);}@TestpublicvoidchargesFullPriceBelowTheThreshold(){PricingPolicy pricing =newPricingPolicy(bulkThreshold(10),bulkDiscountRate(0.15));Order order =newOrder(newLineItem("widget",money("20.00"),quantity(9)));assertEquals(money("180.00"), pricing.totalFor(order));}
Good Practices
Design for idempotency and read-only behavior: Keep smoke tests non-destructive so they can run safely against live production environments without corrupting customer data, charging credit cards, or sending false operational emails.
Target deep health endpoints: Use application endpoints that actively verify connectivity to backend resources (database reads, Redis caches, downstream dependency reachability) rather than shallow /ping endpoints that only return 200 OK from the web server process.
Automate immediate rollback gates: Tie smoke test outcomes directly into your CD pipeline (e.g., progressive delivery, canary, or blue/green deployments). If the smoke suite fails, the deployment halts and rolls back automatically without human intervention.
Verify deployment identity: Assert that the deployed system is serving the exact build artifact, tag, or Git commit hash intended for the deployment to catch caching or orchestration misconfigurations.
Anti-Patterns
Mutating real production data: Creating synthetic test users, modifying real records, or generating phantom financial transactions without rigorous isolation or synthetic-data isolation strategies.
Bloating into a full regression suite: Packing dozens of detailed integration checks into the smoke run, slowing pipeline execution from seconds into tens of minutes and defeating the purpose of a fast sanity gate.
Ignoring downstream read timeouts: Setting long or infinite request timeouts that cause the deployment pipeline to hang indefinitely when an infrastructure route or firewall rule is misconfigured.
Running exclusively in staging: Skipping smoke tests in production under the false assumption that passing staging guarantees environment-specific configs, network policies, and IAM roles are correctly wired in production.
Weaknesses & Challenges
Coarse-Grained Blind Spots: Smoke tests only verify that the front door is open and core pipes are connected; they cannot catch subtle business regressions, boundary calculation errors, or minor UI rendering glitches.
Risk of Production State Side Effects: If write checks are included, synthetic data can leak into operational reports, analytics dashboards, or customer views, requiring custom clean-up routines that are prone to failure.
Permissions and Security Boundaries: Probing internal services and operational health endpoints in locked-down production environments often requires elevated network routes or secure service tokens that must be strictly audited and maintained.
Handling Transient Startup Latency: Newly launched containers, warm-up caches, or JIT compilation can cause false-positive smoke failures immediately following a rollout if proper readiness probes and retry loops are not configured.
Connection to CD Pipeline
Smoke tests are run after every deploy to validate the deploy. They are also used to trigger auto-rollback in the pipeline if they don’t pass.
3.6.7 - Unit Tests
Fast, deterministic tests that verify a unit of behavior through its public interface, asserting on what the code does rather than how it works.
Definition
Verification of the smallest testable piece of code—typically a single function, method, or class—in complete isolation from the rest of the application, network, file system, or external services. Test doubles are used where needed.
Scope & Boundaries
Execution runs entirely in-memory. All external dependencies (databases, APIs, message brokers, system clocks) are replaced with test doubles (stubs, mocks, or fakes).
Test public behavior, not implementation details: Assert on return values and visible side effects rather than internal private state or execution paths.
Strict isolation: Keep all tests in-memory; mock or stub out network, disk I/O, database, and system time to ensure sub-millisecond execution.
Single assertion concept: Each test should verify one specific behavior or edge case to maintain pinpoint failure localization.
Anti-Patterns
Over-mocking: Mocking domain entities, data transfer objects, or language primitives instead of purely external/infrastructure boundaries.
Testing private methods: Forcing visibility or coupling tests to internal helper methods, which causes refactoring resistance without increasing behavioral confidence.
Inter-test dependencies: Letting execution order matter or sharing mutable global state between test cases.
Solitary vs. sociable unit tests
A solitary unit test replaces all collaborators with test doubles. A sociable unit test allows real in-process collaborators while still replacing any external I/O. Both styles are unit tests as long as no real external dependency is involved.
When to Run Them
During development: run the relevant subset of unit tests continuously while writing
code. TDD (Red-Green-Refactor) is the most effective workflow.
On every commit: use pre-commit hooks or watch-mode test runners so broken tests never
reach the remote repository.
In CI: execute the full unit test suite on every pull request and on the trunk after
merge to verify nothing was missed locally.
Unit tests are the right choice when the behavior under test can be exercised without network
access, file system access, or database connections. If you need any of those, you likely need
a component test or an end-to-end test instead.
Examples
JavaScript unit test for castArray utility
// castArray.test.jsdescribe("castArray",()=>{it("should wrap non-array items in an array",()=>{expect(castArray(1)).toEqual([1]);expect(castArray("a")).toEqual(["a"]);expect(castArray({a:1})).toEqual([{a:1}]);});it("should return array values by reference",()=>{const array =[1];expect(castArray(array)).toBe(array);});it("should return an empty array when no arguments are given",()=>{expect(castArray()).toEqual([]);});});
A Java sociable unit test exercising real domain logic through its public interface. The
collaborators (the pricing policy and the order model) are real objects, not mocks, and the test
asserts on the observable outcome - the computed total - rather than on which methods were called:
Java sociable unit test for a bulk-discount pricing rule
@TestpublicvoidappliesBulkDiscountWhenQuantityReachesThreshold(){// Arrange: real collaborators, no test doubles - this is pure in-process logicPricingPolicy pricing =newPricingPolicy(bulkThreshold(10),bulkDiscountRate(0.15));Order order =newOrder(newLineItem("widget",money("20.00"),quantity(12)));// ActMoney total = pricing.totalFor(order);// Assert: the observable result, not the sequence of internal calls// 12 * 20.00 = 240.00, less 15% = 204.00assertEquals(money("204.00"), total);}@TestpublicvoidchargesFullPriceBelowTheThreshold(){PricingPolicy pricing =newPricingPolicy(bulkThreshold(10),bulkDiscountRate(0.15));Order order =newOrder(newLineItem("widget",money("20.00"),quantity(9)));assertEquals(money("180.00"), pricing.totalFor(order));}
Connection to CD Pipeline
Unit tests run in the earliest stages of the
CD pipeline and provide the fastest feedback loop:
Local development: watch mode reruns tests on every save.
Pre-commit: hooks run the suite before code reaches version control.
PR verification: CI runs the full suite and blocks merge on failure.
Integrated change verification: CI reruns tests on the merged HEAD to catch integration issues.
They should always halt the CD pipeline on failure.
3.7 - Patterns
Eight common component patterns and how to test each fully. Each page covers what to verify, positive and negative cases, double validation, pipeline placement, and a small code example.
Each page in this subsection covers one component pattern. The structure is the same on every page so you can scan-compare:
What needs covered - the layers of testing the pattern typically benefits from.
Positive test cases - common success behaviors worth testing.
Negative test cases - common failure modes that produce production incidents.
Test double validation - how the doubles in pipeline tests stay honest.
Pipeline placement - where each test type tends to run.
Example - a short code sample illustrating one of the harder cases for that pattern.
These are recommended starting points, not exhaustive lists or required gates. Real components have details these pages don’t capture; ignore items that don’t apply, and add items the pattern doesn’t mention but your component clearly needs. The goal is to prompt the conversation, not to constrain it.
API provider, API consumer, scheduled job, and user interface are covered in depth. Event consumer, event producer, CLI/library, and stateful service are deliberately briefer sketches: the same six principles apply, the same checklist still prompts useful questions, and the test double validation model is the same. Use the briefer sketches as a starting point and expand the depth in your own runbooks for the patterns your services actually use.
The patterns
API provider - a backend service exposing an HTTP/gRPC/GraphQL API and owning its own data.
API consumer - the above, plus outbound calls to other services. The most failure-prone pattern.
Scheduled job - a service triggered on a cron, queue, or external scheduler.
User interface - a UI that renders data and accepts user interaction.
Event consumer - a service that consumes messages from a broker.
Event producer - a service that produces messages to a broker.
Layered diagram of an API provider showing four architectural layers stacked top to bottom. The first three are inside the component boundary: HTTP and API surface (covered by component tests and provider contract tests), domain logic (covered by solitary unit, sociable unit, and component tests), and persistence adapter (covered by sociable unit, adapter integration, and component tests). Below the dashed component boundary, the external database is doubled in component tests (in-memory or testcontainer) and used real in adapter integration tests against the production engine.
Positive test cases
Common cases to consider, not an exhaustive list. Drop items that don’t apply and add ones the pattern doesn’t mention but your component needs.
Documented endpoints: return the expected shape and status for valid input.
Auth: succeeds for valid credentials and tokens.
Pagination, filtering, sorting: all return the documented results.
Idempotency: idempotent operations are idempotent; non-idempotent operations create exactly one record.
Success-path side effects: events emitted and audit log entries happen on the success path.
Negative test cases
Common cases to consider, not an exhaustive list. Drop items that don’t apply and add ones the pattern doesn’t mention but your component needs.
Malformed body: bad JSON, missing required fields, wrong types, extra fields handled per the documented policy (reject vs. ignore).
Out-of-range values: negatives where positives are expected, oversize strings, unicode edge cases.
Auth failures: missing token, expired token, valid token with insufficient scope, valid token for a different tenant.
Authorization boundaries: user A cannot read or modify user B’s resources.
Resource not found: referenced IDs don’t exist, return 404 not 500.
Concurrency: two writes to the same resource at once, optimistic-lock conflict handled with the documented status code.
Persistence failure: DB unavailable, deadlock, constraint violation. The error envelope is correct and no partial state is committed.
Rate limiting and request size limits: both enforce as documented.
Idempotency under retry: same idempotency key within the window returns the original result, not a duplicate write.
Test double validation
Doubles in this pattern are mostly around persistence. Two layers keep them honest:
Adapter integration tests run against a real instance of your production database engine (the same major version, same extensions). If component tests use an in-memory SQLite shim while production runs Postgres, the shim is the lie. The adapter integration test exercises every query and migration against a Postgres testcontainer in CI.
Provider-side contract tests verify the API still satisfies every published consumer expectation. See Consumer and Provider Perspectives. Provider verification is where you discover that a “harmless” field rename broke a consumer before that consumer deploys.
Pipeline placement
Unit + sociable unit tests: pre-commit and CI Stage 1.
Adapter integration tests against testcontainers: CI Stage 1 if fast, Stage 2 otherwise.
Component tests: CI Stage 1.
Provider-side contract verification: CD Stage 1 (Contract and Boundary Validation).
Example: component test
A flow-oriented component test for an order-placement endpoint. The full app is assembled with an in-memory order repository and an in-memory event bus. The test drives the assembled component through its HTTP handlers and asserts on observable outcomes (status, persisted state, emitted event):
import request from"supertest";import{ buildApp }from"./app.js";import{ InMemoryOrderRepo }from"./test/in-memory-order-repo.js";import{ InMemoryEventBus }from"./test/in-memory-event-bus.js";test("places order with valid payment creates order and emits OrderPlaced",async()=>{const orderRepo =newInMemoryOrderRepo();const events =newInMemoryEventBus();const app =buildApp({ orderRepo, events });const res =awaitrequest(app).post("/orders").set("Authorization","Bearer tok_valid").send({items:[{sku:"A1",qty:2}],paymentToken:"pm_ok"});expect(res.status).toBe(201);expect(orderRepo.findById(res.body.id)).toBeDefined();expect(events.published).toContainEqual(
expect.objectContaining({type:"OrderPlaced",orderId: res.body.id }));});
The test asserts on what a real caller can observe, not on private methods or call sequences inside the controller.
3.7.2 - API Consumer
An API provider that also consumes one or more upstream APIs. The most failure-prone pattern in distributed systems and the one that gets the most testing attention.
Same as API provider, plus outbound HTTP/gRPC calls to services the team does not own (or does own but deploys independently). This is the most failure-prone pattern in distributed systems and gets the most testing attention.
Layered diagram of an API consumer with seven architectural layers. The first five (HTTP and API surface, domain logic and orchestration, resilience policy, outbound HTTP client, persistence adapter) are inside the component boundary. Below the dashed boundary, the external database and the external downstream service are drawn with dashed borders. Component tests cover every internal layer including resilience, with both database and downstream service doubled. Adapter integration tests pin the outbound and persistence protocols against real containers. Consumer contract tests pin the outbound boundary. Out-of-band integration tests exercise the real downstream service to confirm doubles still match reality.
Positive test cases
Common cases to consider, not an exhaustive list. Drop items that don’t apply and add ones the pattern doesn’t mention but your component needs.
Outbound call: constructs the right URL, headers, body, auth, and timeout.
Success response: parsed correctly, including optional fields and unknown fields per Postel’s Law.
Multi-call composition: multiple downstream calls in sequence or parallel produce the documented composite response.
Caching: returns the cached value within TTL and refreshes after.
Trace context: propagates downstream.
Negative test cases
Common cases to consider, not an exhaustive list. The bulk of the negative testing happens here, and it’s where most production incidents originate. Drive each failure mode through a client double that simulates it.
Timeout (downstream exceeds configured deadline): the deadline enforces; the upstream caller gets the documented response (e.g., 504); no partial state is committed. Use a client double that delays past the deadline.
Connection refused: retry policy executes the documented count and backoff; falls over to fallback or returns an error. Use a client double that rejects the connection.
5xx responses (500, 502, 503): retry only on retryable codes. Use a client double that returns 5xx.
4xx responses (400, 401, 403, 404, 409, 422, 429): each maps to documented behavior; 4xx generally not retried; 429 respects Retry-After. Use a client double that returns each code.
Slow response within timeout: performance-budget assertions hold if the service has SLO commitments. Use a client double that delays within the deadline.
Malformed response body: the response is rejected, not silently coerced. Use a client double that returns a truncated or wrong-type body.
Schema drift (extra or missing fields): extra fields tolerated; missing required fields detected with a clear error. Use a client double that returns a drifted body.
Wrong status code (200 with error body, 500 with success body): the client trusts the status code, not the body. Use a client double that returns mismatched status and body.
Circuit open: the circuit opens under sustained failure; fast-fails subsequent calls; recovers on a half-open probe. Use a client double that sustains failures.
Partial multi-call failure: compensation, rollback, or documented partial-success behavior. First client double succeeds, second fails.
Test double validation
This is where the “doubles need tests” rule lives or dies. Four layers:
Consumer-side contract tests run in the pipeline on every commit using doubles. They pin the request the consumer sends and the response shape the consumer depends on. Contract artifacts are published to a broker. Fast, deterministic, blocks the build.
Adapter integration tests exercise the outbound HTTP client against the real dependency in a controlled state - typically a testcontainer running an in-house service the team owns. They verify the adapter code correctly speaks the protocol: serialization, deserialization, header handling, timeout behavior, error mapping. The test asserts the adapter’s correctness, not the dependency’s behavior: if the test asks for a user, it validates that the response parses into a valid User, not which user was returned. For third-party dependencies the team can’t run in a controlled state, run these tests out-of-band on a schedule. WireMock loaded with provider-supplied fixtures is a useful complement but functions more like a contract test against recorded shapes than an integration test against the live protocol.
Provider-side contract verification runs in the provider’s pipeline. The provider executes every consumer’s published contract against the real provider implementation. Breaking changes are caught at the source before the provider deploys.
Post-deploy integration check runs periodically against the real downstream in a non-production environment. Same fixtures used in contract tests. Catches drift in fields the contract didn’t pin, version skew, environment differences. Failures trigger review, not a build break. See Out-of-Pipeline Verification.
For third-party APIs you do not control, there is no provider verification step. The post-deploy check against the live (or sandbox) API is the only mechanism keeping doubles honest. Run it more often than for in-house dependencies. Daily at minimum.
The anti-pattern to avoid: stubbing the third-party SDK directly. Always wrap third-party clients in a thin adapter the team owns, then double the adapter. This is called out explicitly as Mocking what you don’t own and is the single most common source of “but it worked in tests” incidents.
Consumer-side contract tests: pre-commit and CI Stage 1.
Adapter integration tests for the outbound HTTP client against an in-house dependency the team controls (a testcontainer running the team’s own service in a known state): CI Stage 1 or Stage 2.
Adapter integration tests against a third-party API or a service owned by another team: out-of-band on a schedule, never in-band. The risk of a flaky external service blocking deploys outweighs any in-band coverage benefit, and adapter tests with WireMock fixtures already cover the team’s adapter code.
Resilience component tests with fault injection: CI Stage 1.
Post-deploy integration checks against real downstreams: out of pipeline, on a schedule.
Example: fault injection at the client double
A negative-path test for downstream timeout. The payment client double simulates a slow response, the test asserts the deadline enforces and the upstream caller gets the documented error envelope:
test("returns 504 when payment service exceeds deadline",async()=>{const slowPayments ={charge:()=>newPromise((_, reject)=>{setTimeout(()=>reject(newTimeoutError("payments")),50);})};const orderRepo =newInMemoryOrderRepo();const app =buildApp({ orderRepo,payments: slowPayments,deadlineMs:30});const res =awaitrequest(app).post("/orders").set("Authorization","Bearer tok_valid").send({items:[{sku:"A1",qty:1}],paymentToken:"pm_ok"});expect(res.status).toBe(504);expect(res.body.error.code).toBe("UPSTREAM_TIMEOUT");expect(orderRepo.all()).toHaveLength(0);});
The test verifies three things at once: the documented status code, the structured error body the API contract promises, and that no partial state was committed.
3.7.3 - Scheduled Job
A service triggered on a cron, queue, or external scheduler. Reads from data sources, writes reports or updates state.
A job that runs on a cron, queue, or external scheduler. Reads from data sources, writes reports or updates state. Often has no inbound API surface. The entrypoint is the scheduler.
This pattern has two test design challenges that the API provider and API consumer patterns don’t have: time and data volume.
Layered diagram of a scheduled job with six architectural layers. The first four (pure transformation logic, job orchestration, source and sink gateways, process startup) are inside the component boundary. Below the dashed boundary, the external source and sink and the external scheduler and system clock are drawn with dashed borders. Solitary unit tests cover pure transformation. Component tests cover orchestration with the clock and gateways doubled. Adapter integration tests pin source and sink protocols against real containers. Deployed-binary tests cover process startup on the actual artifact the scheduler will invoke. Out-of-band integration uses the real scheduler and clock on a schedule.
Process startup matters more here than for an API service, because scheduled jobs typically have non-trivial startup behavior (config loading, secret resolution, lock acquisition) that a component test with the SUT in-memory can bypass. The right shape is many component tests for behavior, plus one or two tests that invoke the actual deployed binary the scheduler will invoke.
Positive test cases
Common cases to consider, not an exhaustive list. Drop items that don’t apply and add ones the pattern doesn’t mention but your component needs.
End-to-end run: with representative input, produces the expected output (report file, database update, message published).
Idempotency: running the job twice for the same logical period produces the same result, not duplicates.
Checkpointing: a job that processes a stream resumes from the last checkpoint, not from scratch.
Time windows: “yesterday’s data” computes correctly for various reference times, especially around DST, month boundaries, and year boundaries.
Empty input: zero records produces a valid empty report, not an error.
Output format: the report or message conforms to the documented schema.
Negative test cases
Common cases to consider, not an exhaustive list. Drop items that don’t apply and add ones the pattern doesn’t mention but your component needs.
Source unavailable: DB down, source API returning 5xx. Verify the job fails cleanly with a documented exit code/status, doesn’t write partial output, and is safely re-runnable.
Sink unavailable: destination DB or message broker rejects writes. Verify no source state changes (e.g., “marked as processed”) happen if the sink fails.
Partial-write failure: half the batch writes successfully, then the connection drops. Verify the next run reprocesses the failed half without duplicating the successful half. This is where idempotency keys, transactional outboxes, or compensating reads earn their keep.
Slow job: job exceeds its expected runtime. Verify it surfaces as alertable, doesn’t silently overlap with the next scheduled run, and that the lock prevents concurrent execution.
Malformed source data: null where non-null was expected, wrong type, encoding issues. Verify the bad record is logged with enough context to investigate, and the job decides per its policy: skip, dead-letter, or fail the whole run. The choice is design; the test pins it.
Time-zone bugs: the job runs at 02:30 UTC for a “daily” report. What does it do on the day clocks shift? Test it. Use the injected clock so the test deterministically simulates the boundary.
Concurrent run: the previous run hadn’t finished when the next was triggered. Verify the lock prevents overlap or, if overlap is acceptable, that the work is partitioned correctly.
Crash mid-run: kill -9 in the middle of processing. Verify on restart the job resumes from a consistent state.
Schema drift on source: a new field appears or a field changes type. Verify per the contract policy.
Test double validation
Three classes of doubles need validation, each through a different mechanism:
The injected clock. Every in-band test that depends on “now” uses an injected clock. Validate it with one out-of-band check that runs against the real system clock, exercises a known time-window calculation, and confirms the production wiring of the clock dependency is correct. This catches the “tests use UTC, prod uses container local time” class of bug.
Source and sink gateways. Same model as the API consumer pattern. Adapter integration tests in the pipeline exercise each gateway against a real source/sink container or WireMock. Contract tests pin the shape. Post-deploy integration checks confirm the doubles still match the real systems on a schedule.
The scheduler trigger. The doubled trigger in component tests must match what the real scheduler invokes. Verify with a post-deploy integration check that runs the real scheduler against a deployed instance in a non-prod environment and confirms the entrypoint is found, the cron expression fires at the expected times, environment variables and secrets resolve, and the concurrency policy holds. This is the test that catches “passed in CI, didn’t run in prod because the cron expression had a typo.”
Pipeline placement
Unit and component tests: CI Stage 1.
Adapter integration tests for the source and sink adapters: CI Stage 1 or Stage 2.
Contract tests for each source and sink: CI Stage 1.
Component tests of the deployed binary (small set): CI Stage 1 or Stage 2.
Real-clock and real-scheduler integration check: out of pipeline, scheduled, against a non-prod environment.
Post-deploy: a synthetic invocation of the job in production that verifies it ran, processed records, and met its SLO.
Example: time-window logic with an injected clock
A test that pins the daily-report window calculation around a DST boundary. The clock is injected so the test deterministically simulates the moment of interest. source and sink are field-level fakes set up in the test class with seeded data for 2026-03-08 and 2026-03-09.
test("daily report run after DST spring forward uses correct window",()=>{const fixedClock ={now:()=>newDate("2026-03-09T07:30:00Z")};const job =newReportJob({clock: fixedClock, source, sink });
job.run();const emitted = sink.lastReport();expect(emitted.windowStart).toEqual(newDate("2026-03-08T05:00:00Z"));expect(emitted.windowEnd).toEqual(newDate("2026-03-09T05:00:00Z"));expect(emitted.recordsProcessed).toBe(source.recordsForDay("2026-03-08"));});
A separate out-of-band check runs the deployed binary against the real system clock once, to verify the production wiring of the clock dependency matches the doubled clock used here.
3.7.4 - User Interface
A UI that renders data and accepts user interaction. Talks to one or more backend APIs.
A UI that renders data and accepts user interaction. Talks to one or more backend APIs.
Layered diagram of a user interface with five architectural layers. The first four (pure rendering, component composition, feature behavior in the rendered DOM, backend HTTP client) are inside the component boundary. Below the dashed boundary, the external backend API is drawn with a dashed border. Solitary unit tests cover pure rendering. Sociable unit tests cover composition. Component tests driven by Playwright cover feature behavior with the backend doubled at the network layer. Consumer contract tests pin each backend boundary. End-to-end tests run post-deploy against the real backend.
UI component tests run in a real browser engine (Chromium, Firefox, WebKit) driven by Playwright, with the team’s existing unit-testing framework (Vitest, Jest, or whatever is already in the project) as the runner. In-memory renderer shortcuts like JSDOM are rejected: they trade accuracy for speed and produce false greens around layout, focus, event timing, Intersection Observer, and animations - exactly the surface where UI bugs live. Playwright’s headless Chromium starts in milliseconds and runs the suite fast enough to use as the default. Backends are stubbed at the network layer with page.route so the same fixtures drive component tests today and end-to-end smoke tests later.
Positive test cases
Common cases to consider, not an exhaustive list. Drop items that don’t apply and add ones the pattern doesn’t mention but your component needs.
Critical flows: a user can complete each documented critical flow via keyboard and via mouse.
Forms: accept valid input, submit, and show success.
Loading states: render while the backend is in flight.
Empty, populated, and overflow states: all render correctly.
Internationalization: the UI renders with longer translations and right-to-left scripts.
Responsive layouts: render at the documented breakpoints.
Negative test cases
Common cases to consider, not an exhaustive list. Drop items that don’t apply and add ones the pattern doesn’t mention but your component needs.
Backend errors: for every API call the UI makes, what does the user see for 4xx, 5xx, network failure, timeout? Test each. The most common UI bug is “spins forever on error.”
Form validation: required fields, format errors, length limits, cross-field rules. Each shows a specific, actionable message that’s announced to screen readers.
Authentication expiry: token expires mid-session. Verify the user is sent through the documented re-auth flow, not silently dropped.
Permission denied: the user navigates to a page they cannot access. Verify the documented response (redirect, “not authorized,” etc.).
Stale data: a list rendered, then a delete on another tab, then the user clicks the deleted item. Verify the documented refresh or error behavior.
Slow network: every interaction has a documented behavior at 3G speeds. Verify with throttled fixtures.
Concurrent edit: two users editing the same record. Verify the optimistic-lock UX behaves as documented.
Browser back button: the back button is a public interface. Test it.
Accessibility violations: automated WCAG scan in component tests catches missing labels, contrast failures, ARIA misuse on every commit. Don’t defer to quarterly audits.
Test double validation
Backend doubles in component tests must match the real backends. Same mechanism as the API consumer pattern: the UI is a consumer, every backend it talks to is a provider. Consumer-driven contracts run on every commit; provider verification runs in the backend’s pipeline. Post-deploy E2E smoke tests against the real backend close the loop on drift the contract didn’t pin.
Because UI component tests run in a real browser engine, there is no renderer-level double to validate. The browser is the production renderer, just headless. The remaining gap is between the stubbed backend and the real backend, which the out-of-band E2E suite covers. Out-of-band failures trigger review, not a build break.
Component tests in headless browser (including a11y assertions): CI Stage 1.
Visual regression: CI Stage 1 if fast, CI Stage 2 if slow.
Consumer-side contract tests for each backend: CI Stage 1.
E2E happy-path smoke tests against real backends: post-deploy, in a production-like environment, blocking the rollout but not the build.
Real user monitoring + synthetic transactions: continuously in production.
Example: UI component test for an error path
A flow-oriented test for the checkout error path. Playwright drives a headless browser; the backend is stubbed at the network layer with page.route; the team’s existing unit-testing framework (Vitest, JUnit, xUnit) runs the test. The assertion: the user sees a documented error message and the spinner does not get stuck.
[Fact]publicasyncTaskShows_error_and_clears_spinner_when_checkout_fails_with_500(){usingvar playwright =await Playwright.CreateAsync();awaitusingvar browser =await playwright.Chromium.LaunchAsync();var page =await browser.NewPageAsync();await page.RouteAsync("**/api/checkout", route => route.FulfillAsync(new(){
Status =500,
ContentType ="application/json",
Body ="{\"error\":{\"code\":\"INTERNAL\"}}"}));await page.GotoAsync("http://localhost:3000/checkout");await page.GetByRole(AriaRole.Button,new(){ Name ="Place order"}).ClickAsync();awaitExpect(page.GetByRole(AriaRole.Alert)).ToContainTextAsync("Something went wrong, please try again");awaitExpect(page.GetByRole(AriaRole.Status)).Not.ToBeVisibleAsync();}
import{ test, expect, beforeAll, afterAll }from"vitest";import{ chromium }from"playwright";let browser;beforeAll(async()=>{ browser =await chromium.launch();});afterAll(async()=>{await browser.close();});test("shows error and clears spinner when checkout fails with 500",async()=>{const page =await browser.newPage();await page.route("**/api/checkout",route=>
route.fulfill({status:500,contentType:"application/json",body:JSON.stringify({error:{code:"INTERNAL"}}),}));await page.goto("http://localhost:3000/checkout");await page.getByRole("button",{name:/place order/i}).click();awaitexpect(page.getByRole("alert")).toContainText(/something went wrong, please try again/i);awaitexpect(page.getByRole("status")).not.toBeVisible();});
The test exercises the rendered DOM the way a real user would. Intercepting at the network layer with page.route keeps the same fixtures reusable when the component test gets promoted to an end-to-end smoke test against the real backend.
3.7.5 - Event Consumer
A service that consumes messages from a broker (Kafka, SQS, RabbitMQ, Pub/Sub). Brief sketch.
A consumer of messages from Kafka, SQS, RabbitMQ, Pub/Sub, or similar. Reads messages, processes them, often updates state and produces downstream messages. The “public interface” is the topic or queue and the schema of messages on it.
This pattern has problems the API provider and API consumer patterns don’t have: ordering, replay, poison messages, dead-letter queues, and delivery semantics (at-most-once, at-least-once, exactly-once-with-effort).
Layered diagram of an event consumer with six architectural layers. The first five (message handler logic, idempotency and ordering, dead-letter and poison-message handling, backpressure, broker client) are inside the component boundary. Below the dashed boundary, the external broker and schema registry are drawn with a dashed border. Solitary unit tests cover handler logic. Component tests cover idempotency, dead-letter handling, ordering, and backpressure with the broker doubled. Adapter integration tests pin the broker protocol against a real broker container. Broker contract tests pin the topic, schema, and headers. Out-of-band synthetic publish confirms the doubles still match the real broker.
Positive test cases
Common cases to consider, not an exhaustive list. Drop items that don’t apply and add ones the pattern doesn’t mention but your component needs.
Well-formed message: produces the expected state change and the documented downstream events.
Batch processing: processes per documented policy.
Replay from offset: reproduces the same end state.
Documented schema versions: are accepted.
Negative test cases
Common cases to consider, not an exhaustive list. Drop items that don’t apply and add ones the pattern doesn’t mention but your component needs.
Malformed message: routes to the DLQ with a correlation ID; the consumer survives.
Duplicate delivery: absorbed by idempotency.
Out-of-order delivery: follows the documented behavior.
Mid-batch downstream failure: the offset is left uncommitted.
Schema-version skew: handled per the documented policy.
Slow downstream: applies backpressure rather than OOM.
Consumer-group rebalance during processing: no in-flight messages are stranded.
Test double validation
The broker double in component tests is validated by adapter integration tests against a real broker container the team controls (Kafka in Docker, ElasticMQ for SQS, Redpanda in Docker). The test exercises the broker client adapter against that controlled instance and asserts the adapter speaks the protocol correctly - it does not assert anything about which messages the broker returns or in what order; that is the broker’s behavior, not the adapter’s. Schema registry double is validated by contract tests pinning each version, plus a post-deploy check against the real registry. Post-deploy synthetic publishes a known message to the real topic in a non-prod environment.
Pipeline placement
Handler unit tests and component tests run in CI Stage 1; adapter integration tests against a team-controlled broker container in CI Stage 1 or Stage 2; adapter integration tests against a managed broker the team can’t pin to a known state run out-of-band on a schedule, alongside the post-deploy synthetic.
Example: idempotency under duplicate delivery
Money.usd takes minor units (cents); 4250 represents $42.50.
A service that produces messages to a broker. Often paired with the event consumer pattern in the same service. Brief sketch.
The producer side, often paired with the Event consumer pattern in the same service. After a state change, the service publishes a message that downstream consumers depend on.
The hard problems differ from the consumer side: atomicity with persistence (did the DB row commit and the message publish?), exactly-once semantics that require an outbox or two-phase commit, and downstream consumer dependence on schema, routing key, and headers.
Layered diagram of an event producer with five architectural layers. The first three (domain emit decision, outbox or transactional emit, broker client) are inside the component boundary. Below the dashed boundary, the external broker and the database used by the outbox are drawn with dashed borders. Solitary unit tests cover the emit decision logic. Component tests cover outbox atomicity, retry on broker unavailable, and trace propagation, run with a real database and a doubled broker. Adapter integration pins the broker protocol against a real broker container. Provider contract verification runs against every consumer's published expectations. Out-of-band synthetic state change confirms the message arrives in the real broker.
Positive test cases
Common cases to consider, not an exhaustive list. Drop items that don’t apply and add ones the pattern doesn’t mention but your component needs.
State change: produces the correct message on the correct topic with the correct routing key, headers, and schema version.
Outbox drain: drains in order.
Redelivery: does not reorder.
Negative test cases
Common cases to consider, not an exhaustive list. Drop items that don’t apply and add ones the pattern doesn’t mention but your component needs.
DB commits but broker fails: the message stays in the outbox and emits on the next drain. No event lost.
Broker accepts but DB rolls back: nothing is emitted. No phantom events.
Broker unavailable for an extended period: the outbox accumulates with bounded growth and alerts at a threshold.
Breaking schema change: fails provider-side contract verification before shipping.
Test double validation
The broker double in component tests is validated against a real broker container the team controls in adapter integration tests. The test asserts the adapter publishes with the right routing key, headers, and serialization - it does not assert which messages downstream consumers happen to read or in what order; those are downstream concerns. Provider-side contract verification runs in this service’s pipeline against every consumer’s published expectations.
Pipeline placement
Outbox component tests and routing tests run in CI Stage 1; adapter integration tests against a team-controlled broker container in CI Stage 1 or Stage 2; adapter integration tests against a managed broker the team can’t pin run out-of-band on a schedule. Provider-side contract verification in CD Stage 1; post-deploy synthetic state change verifies the message arrives with the expected shape.
3.7.7 - CLI Tool or Library
A binary or package consumed by other developers. The public interface is the CLI invocation surface or the library’s exported API. Brief sketch.
A binary (CLI) or package (library) consumed by other developers. The “public interface” is the CLI invocation surface (argv, stdin, stdout, stderr, exit code) or the library’s exported API.
The pattern is different because the consumer is a developer or another program, not a user clicking a button. Cross-platform behavior, semantic versioning, and backward compatibility matter more than they do for a service.
Layered diagram of a CLI tool or library with five architectural layers. The first four (pure logic and parsing, CLI invocation surface or library API, file system and subprocess adapter, documented README examples) are inside the component boundary. Below the dashed boundary, the real OS, file system, and subprocess are drawn with a dashed border. Solitary unit tests cover pure logic and parsing. Component tests cover invocation through the entrypoint. Adapter integration tests cover the file system and subprocess against the real OS in a temp directory. The API surface diff catches removal or rename of any public symbol. Doctests verify README examples run against the real binary or library. The cross-OS CI matrix runs the suite on every supported OS to catch platform-specific bugs.
Positive test cases
Common cases to consider, not an exhaustive list. Drop items that don’t apply and add ones the pattern doesn’t mention but your component needs.
Valid arguments: produce documented stdout output, no stderr, and exit code 0.
Pipe-friendly mode: produces machine-readable output (JSON/NDJSON) when stdout is not a TTY.
Library API: returns documented values for valid input.
Negative test cases
Common cases to consider, not an exhaustive list. Drop items that don’t apply and add ones the pattern doesn’t mention but your component needs.
Bad arguments: exit with the documented non-zero code and structured stderr.
Help text: reachable via --help.
Large input: does not OOM.
Interrupt (Ctrl-C, SIGTERM): runs cleanup and flushes or rolls back partial output.
Invalid arguments to the library: throws the documented error type.
Public symbol removed or renamed: the API-surface test fails the build.
Test double validation
File system doubles validated by integration tests against the real FS in a temp directory. Subprocess doubles validated by tests that actually spawn the subprocess on each supported OS. Doctests validate README examples against the real binary or library on every build.
Pipeline placement
Unit and component tests run in CI Stage 1 on every supported OS; API surface diff and doctests in CI Stage 1; cross-platform integration tests in CI Stage 2 if slow.
3.7.8 - Stateful Service
A service that maintains long-lived in-memory state: caches, in-memory aggregates, leader-elected coordinators, websocket gateways, real-time engines. Brief sketch.
A service that maintains long-lived in-memory state: caches, in-memory aggregates, leader-elected coordinators, websocket gateways, real-time engines, sticky-session servers.
The hard problems are concurrency, recovery, and unbounded growth. Stateful services fail in ways stateless services do not.
Layered diagram of a stateful service with six architectural layers. The first five (state machine logic, persistence and recovery, single-node concurrency, replication and leader election, memory bounds and long-run behavior) are inside the component boundary. Below the dashed boundary, the persistence engine is drawn with a dashed border. Solitary unit tests cover state transitions. Component tests cover persistence, recovery, and single-node concurrency. Cluster tests exercise replication and leader election against a multi-node testcontainer setup. Out-of-band soak and chaos tests catch unbounded growth, slow leaks, and replication-lag drift against a deployed instance.
Positive test cases
Common cases to consider, not an exhaustive list. Drop items that don’t apply and add ones the pattern doesn’t mention but your component needs.
State transitions: follow the documented machine.
Restart: state rebuilds and behavior matches pre-restart.
Replication lag under expected load: stays within budget.
Negative test cases
Common cases to consider, not an exhaustive list. Drop items that don’t apply and add ones the pattern doesn’t mention but your component needs.
Crash mid-write: consistent state on restart. No torn writes.
Network partition: minority replicas step down with documented reconciliation on heal.
Slow replication: applies backpressure rather than silent divergence.
Memory pressure: evicts oldest entries per policy without OOM.
Idle long-running connections: close cleanly with documented reconnect behavior.
Concurrent state mutations: serialize without lost updates.
Test double validation
Persistence doubles validated by adapter integration tests against the real production engine. Consensus library doubles validated by cluster tests against a multi-node testcontainer setup. Soak tests run out of pipeline against a deployed instance to catch slow leaks and unbounded growth.
Pipeline placement
State machine unit tests, recovery component tests, and single-node concurrency tests run in CI Stage 1; cluster tests with real consensus library in CI Stage 2; soak and chaos tests out of pipeline.
3.8 - Applied Testing Strategies
Practical guidance for fully testing eight common component patterns: API providers, API consumers, scheduled jobs, user interfaces, event consumers, event producers, CLI tools and libraries, and stateful services.
A practical guide for fully testing eight common component patterns. Builds on the test-type definitions in Architecting Tests for CD and the deterministic-pipeline model used throughout this site.
This is a set of recommended patterns to consider when designing a test suite, not a prescriptive checklist. The patterns describe shapes of components teams commonly build; the lists of positive cases, negative cases, and pipeline placements are common things to consider for that shape, not an all-inclusive set. Use them as a starting point for the conversation about what your component actually needs.
That said, three goals apply to every pattern:
Cover the positive paths - the component does what it should under expected inputs.
Cover the negative paths - the component fails safely, predictably, and observably under bad inputs, broken dependencies, and adverse conditions.
Validate the test doubles - every double used to keep deterministic tests fast must be backed by a non-deterministic check that the double still matches reality.
If the third point is missing, the first two lie to you over time.
Looking for a specific concern that crosses every pattern (authn, migrations, fixtures, observability, perf, mutation testing, flake handling, time budgets)? See Cross-cutting concerns.
Two phrases that look similar but mean different things:
Adapter integration test (Toby Clemson’s “integration test”): a narrow test of a single boundary adapter (HTTP client, DB query layer, message-broker client) exercised against the real external dependency or a high-fidelity stand-in. Pins the adapter’s protocol behavior - serialization, deserialization, headers, error mapping - not the behavior of the dependency itself. Runs in-band only when the team has full control over the dependency (typically a per-test testcontainer) and the test is fully deterministic; otherwise runs out-of-band on a schedule.
Out-of-band integration check (this site’s Integration Tests): runs out-of-band on a schedule or post-deploy against real external systems. Confirms that doubles used by in-band tests still match reality. Failures trigger review, not a build break.
When this section says bare “integration test,” it’s the gateway flavor unless qualified.
Cross-cutting principles
Six principles apply to every pattern. The first three are short pointers to pages that own the topic; the last three are unique to this section.
1. In-band tests are deterministic; out-of-band checks confirm reality
In-band tests run in the commit-to-deploy pipeline and gate the build. They must be deterministic, which means test doubles replace anything that crosses the component boundary - downstream services, message brokers, schedulers, browsers talking to real backends. Out-of-band checks run on a schedule or post-deploy against the real systems those doubles stand in for. They confirm the doubles still match reality. Failures trigger review or rollback, not a build break. See the architecture in Architecting Tests for CD.
2. Test doubles need their own tests
Every double is traceable to a contract test pinning its claims and an out-of-band check confirming the claims still hold. The mechanics live in Test Doubles.
3. Test through the public interface
Public methods for classes; HTTP routing for services; rendered DOM for UIs; the entrypoint the scheduler invokes for jobs. See Component Tests. Reflection, package-private back doors, and asserting on private state are tested-the-wrong-thing in disguise.
4. Sociable unit tests dominate; solitary unit tests are the narrow exception
Domain logic in a real system lives in how behaviors collaborate, not in any single class. A sociable unit test drives the actual collaborators that implement a domain operation - validators, domain services, repositories backed by an in-memory or testcontainer double - and asserts on the observable outcome of that operation: the response, the persisted state, the event emitted. That is the bulk of the suite. Solitary unit tests are reserved for genuinely complex pure logic with no collaborators worth wiring up - pricing math, parsers, scheduling arithmetic.
Organize the suite around domain operations (“place an order,” “cancel a subscription within the grace period”), not around the classes or methods that happen to implement them. Tests written this way survive refactoring, catch bugs that live in the interactions between collaborators, and document what the component does to a stakeholder who can’t read the code. Tests written one-class-at-a-time with mocks for every collaborator do none of that.
5. Negative paths get equal weight
For every “it works” test, ask: malformed input, dependency timeout, dependency 500, dependency 200-with-malformed-body, slow response, partial write, duplicate request, missing or wrong authn/authz. Negative paths are where production incidents come from.
6. Name tests in domain terms, not implementation terms
A test name is documentation. places_order_with_valid_payment_creates_order_and_emits_OrderPlaced survives refactoring; OrderService.processPayment_returns_PaymentResult does not. The translation rule: if the name only makes sense to someone who has read the code, rewrite it. Highest-ROI change a team can make to an existing suite without any new infrastructure. For more on what to avoid, see Testing Antipatterns.
Related Content
Architecting Tests for CD - the section overview, with the do/do-not list and the architecture diagram.
Testing Antipatterns - common testing anti-patterns and a migration guide for teams whose suite needs rework.
Quick audit for any component before it ships. Walk back to the section that needs attention for any item that fails.
Use this as a set of prompts for a quick self-audit, not a list of gates that must all pass. Items that don’t apply to a component can be ignored; items the list doesn’t mention but your component clearly needs should be added. Walk back to the pattern or cross-cutting concern that needs attention for any item that prompts a “we should fix that.”
The bulk of the suite is sociable unit tests that exercise how behaviors collaborate to deliver a domain operation. Solitary unit tests are reserved for genuinely complex pure logic.
Tests are organized around domain operations, not around classes or methods. Test names read as something a stakeholder would recognize.
Every public-interface contract (inbound and outbound) has a contract test running in the pipeline.
Classes are tested through their public methods only. No reflection, no test-only visibility relaxations, no asserting on private state.
Every consumed external dependency is wrapped in a gateway the team owns; doubles are of the gateway, not of the third-party library.
Every boundary adapter has an adapter integration test against the real dependency or a high-fidelity stand-in (testcontainer, WireMock with provider fixtures).
The bulk of testing runs in-band in the pipeline and gates the build; out-of-band checks against real systems run on a schedule and trigger review on failure, never a build break.
Every test double has a corresponding non-deterministic check that exercises the real dependency on a schedule or post-deploy.
Every documented failure mode has a negative test.
Every error response has a test that verifies the error envelope, status code, and any side effects (or absence thereof).
Time, randomness, and the network are injected, not called directly. No sleep in tests. Use bounded polling or a fake clock.
All deterministic tests run pre-commit and in CI Stage 1, and fail the build on failure.
All post-deploy integration checks run out of pipeline and trigger review on failure, never blocking a commit.
Pipeline gates map to defect sources from the Systemic Defect Fixes catalog. If a defect category has no automated check, that’s a known risk.
Authn and authz are tested across every protected endpoint, not as one-offs per feature.
Database migrations are tested forward, backward (where supported), and on representative data volume against the production engine.
Fixtures are generated from the schema or built through Object Mother / builder helpers, not inline literals.
Failure-path tests assert on observability (metric incremented, structured log emitted with correlation ID), not just the response.
Per-endpoint perf budgets exist for hot paths; load tests gate production promotion; soak tests run out of pipeline.
Flaky tests are quarantined with a dated owner and time-boxed remediation. No permanent quarantine list.
The deterministic suite respects the pattern’s time budget (under 5 to 8 minutes per component, under 10 minutes total).
3.8.2 - Cross-Cutting Concerns
Concerns that cut across every pattern: authn/authz, database migrations, fixtures, observability, accessibility, performance, mutation testing, flake handling, and time budgets.
The patterns describe testing organized by component shape. The concerns below cut across all patterns and deserve dedicated coverage in any non-trivial system.
Authn and authz testing
Authentication and authorization deserve dedicated, exhaustive coverage. They are a major source of high-impact incidents and the failure modes are predictable:
Tenant isolation: tenant A’s queries never return tenant B’s data. Test every read path. Multi-tenant SaaS bugs are almost always missing isolation tests.
Scope or role escalation: a token with read:orders cannot perform write:orders. Test the matrix of scope and endpoint.
Expired tokens: rejected even if cached locally. Clock-skew tolerance is a property of the verifier, not a license to skip the test.
Forged tokens: signature validation actually validates. The classic JWT alg: none bug still ships periodically.
Missing auth: every protected endpoint returns 401, never 500 (information leak) and never 200 (catastrophic).
The pattern: a parameterized test that takes (endpoint, method, expected-status-when-no-token, expected-status-when-wrong-scope) and runs across every endpoint in the OpenAPI or schema definition. New endpoints are covered automatically.
Database migrations
Migrations have their own discipline. For every migration:
Forward on representative data: produces the expected schema and data.
Backward (where supported): returns to the previous schema with no data loss. Expand-contract migrations may not roll back; that’s a design choice the test pins.
Forward + backward + forward: idempotent.
Time on production-scale data: budget assertion. A 30-minute migration on a 50M-row table needs a different deploy strategy than a 30-second one.
Under traffic: the expand-contract pattern doesn’t break in-flight transactions.
Test against the real production database engine and version using testcontainers. SQLite-against-Postgres is a frequent source of “passed in CI, broke at 02:00 in prod” incidents.
Test data and fixtures
Fixtures rot faster than the code that uses them. Two principles keep them honest:
Generate fixtures from the schema, not by hand. When the schema is the source of truth (Avro, OpenAPI, SQL DDL, Protobuf), generate fixture builders from it. A type change breaks the build, not production.
Use Object Mother or builder patterns, not raw inline literals. A test that says placeOrder(buildValidOrder().withItem("A1", 2).build()) survives a schema change because the builder updates centrally. A test with 30 lines of raw JSON inline does not.
Avoid shared global fixtures that tests mutate. Each test creates the state it needs, names what is essential about that state, and discards the rest.
Observability as a tested artifact
Logs, metrics, and traces are part of a service’s contract with operators. If an alert depends on a metric, the test for the failure path should assert the metric is emitted. If a runbook depends on a structured log line, the test should assert the line is produced with the right fields and correlation ID.
The pattern: in component tests, attach a metrics collector and a log capture to the assembled component. Failure-path tests assert three things at once:
The response status is correct.
The error metric is incremented with the right labels.
The structured log line is emitted with correlation ID, error code, and any fields the runbook depends on.
This prevents silent regressions where the code “works” but the operator can’t see what’s happening when it doesn’t.
Accessibility testing
For any pattern that renders a user interface, accessibility is a functional requirement, not a finishing touch, and it belongs in the same in-band / out-of-band split as every other concern on this page. The dividing line is the one the whole test architecture uses: deterministic checks gate the build; subjective judgment runs continuously and never blocks.
The governing rule: automate the deterministic rules, reserve human judgment for the rest. A large share of WCAG success criteria are machine-checkable - missing alt attributes, invalid or contradictory ARIA, unlabeled form controls, insufficient color contrast, broken heading hierarchy, a missing document language. Those are deterministic and belong in the pipeline. The remainder - whether alt text is meaningful, whether the screen-reader narrative makes sense, whether a flow is actually operable with a keyboard or a switch device - cannot be settled by a tool and must not be faked with one.
Three tiers, mapped to pipeline placement:
Static analysis (in-band, blocks build). Accessibility linting catches structural violations in source without rendering: missing alt text, ARIA misuse, label associations, heading order. It runs in the IDE, pre-commit, and CI, exactly like any other static check. Cheapest and fastest; treat high-severity findings as build-breaking, the same as a security finding.
Component tests against the rendered DOM (in-band, blocks build). Some violations exist only in the rendered output: contrast computed after CSS resolves, focus order, dynamic ARIA state, keyboard operability. A scanner assertion inside a component test (expect(results).toHaveNoViolations()) plus explicit keyboard-navigation assertions cover these deterministically, on every commit. The user interface pattern shows the full shape.
Manual audit and assistive-technology testing (out-of-band, never a gate). Real screen-reader passes, keyboard-only walkthroughs, and expert review of whether the experience is coherent. This is continuous and informs the backlog; like exploratory testing, it is not a pass/fail checkpoint and must not gate a deploy.
The caveat that keeps tiers 1 and 2 honest: automated checks detect only a fraction of WCAG success criteria - industry estimates commonly land between a third and a half, depending on the tool and the page. A green automated scan means “no detectable violations,” not “accessible.” Wiring a scanner into the build is necessary and high-value, but a team that reads a passing scan as proof of accessibility has the same false-confidence problem as a team that reads high line coverage as proof of correctness. The deterministic tiers shrink the manual surface; they do not remove it.
This mirrors observability as a tested artifact above: the machine-verifiable part of a human contract gets pinned in the deterministic suite, and the judgment part stays with people.
Performance and load testing
Three classes of perf tests, each with a different home in the pipeline:
Per-endpoint perf budgets in component tests. Simple latency assertion under no load (assertThat(p99).isLessThan(50ms)). Catches algorithmic regressions cheaply. Fits in CI Stage 1 if the assertions are tight and the runtime is stable.
Load tests in acceptance. k6, Gatling, or Locust against a deployed instance. Validate p99 latency, throughput, and error rate at expected production load. Gates production promotion.
Soak tests out of pipeline. Long-running load to catch memory leaks, file handle leaks, and slow drift. Scheduled, non-blocking.
A perf regression that breaches a documented budget should block deploy. A regression within budget but worse than baseline should generate a finding for review, not a build failure: noisy alerts get ignored.
Mutation testing
Coverage % tells you what code ran. Mutation testing tells you whether the tests would have failed if the code had been wrong. Tools (Stryker for JS, PIT for Java) systematically change operators, return values, and conditionals, then re-run the test suite. Surviving mutants are tests that didn’t catch the mutation.
Each surviving mutant is one of three things:
A real test gap. Add a flow-oriented test that would have failed when the mutation was applied.
An equivalent mutant, semantically identical to the original. Mark and move on.
A trivially equivalent mutant (logging change, assertion message tweak). Configure the tool to skip.
Mutation testing is too slow to run on every commit. Run it nightly or weekly on the highest-value modules. Treat it as a periodic audit of test quality, not a gating check.
Flake handling protocol
A flaky test is a known unknown. Three rules keep flakes from rotting the suite:
Quarantine on detection. First flake gets the test moved to a quarantine lane that doesn’t block the build. Don’t ignore it; don’t keep failing builds for unrelated reasons.
Time-boxed remediation. Quarantined tests have a deadline (e.g., five business days) and an owner. After the deadline, fix or delete. No silent quarantine.
Track the cause. Most flakes share root causes: timing, shared state, network, ordering. The fix is usually structural (eliminate the timing dependency) rather than local (add a longer sleep).
Empirical starting points for in-band test budgets, based on typical service complexity. Adjust for your codebase, language, framework, and the size of the component under test.
Pattern
In-band suite budget
Notes
1 (API provider)
< 5 min
Most logic in unit and component tests
2 (API consumer)
< 5 min
More gateway and resilience tests than 1
3 (scheduled job)
< 3 min
Plus a small set of tests that exercise the deployed binary
4 (UI)
< 8 min
Component tests in headless browser via Playwright + the team’s unit-testing framework
The total CD pipeline in-band suite under 10 minutes is the gating constraint at the team level. The first lever for hitting that budget is parallel execution: the suite should fan out across cores or runners, not run serially. Parallelism only works when tests are independent of each other - no shared mutable state, no ordering dependencies, no global fixtures that one test mutates and another reads. Decoupling tests is a prerequisite for speed, not an optimization on top of it.
If a component’s tests still can’t fit the budget after the suite is running in parallel, the goal is to remediate the underlying cause - slow component startup, oversize fixtures, expensive setup duplicated per test, hidden serialization through a shared resource - not to declare the budget unreachable. While the remediation is underway, moving the offending tests out-of-band on a schedule is a reasonable stopgap so the in-band suite stays fast. Out-of-band placement here is a temporary mitigation, not the destination: those tests should come back in-band once the underlying speed issue is fixed.
3.9 - Test Feedback Speed
Why test suite speed matters for developer effectiveness and how cognitive limits set the targets.
Why speed has a threshold
The 10-minute CI target and the preference for sub-second unit tests are not arbitrary. They are
long-standing conventions in CD practice, and they align with how human cognition handles
interrupted work. When a developer makes a change and waits for
test results, three things determine whether that feedback is useful: whether the developer still
holds the mental model of the change, whether they can act on the result immediately, and whether
the wait is short enough that they do not context-switch to something else.
Research on task interruption and working memory consistently shows that context switches are
expensive. Gloria Mark’s research at UC Irvine found that it takes an average of 23 minutes for
a person to fully regain deep focus after being interrupted during a task, and that interrupted
tasks take twice as long and contain twice as many errors as uninterrupted
ones.1 If the test suite itself takes 30 minutes, the total cost of a single
feedback cycle approaches an hour - and most of that time is spent re-loading context, not fixing
code.
The cognitive breakpoints
Jakob Nielsen’s foundational research on response times identified three thresholds that govern
how users perceive and respond to system delays: 0.1 seconds (feels instantaneous), 1 second
(noticeable but flow is maintained), and 10 seconds (attention limit - the user starts thinking
about other things).2 These thresholds, rooted in human perceptual and
cognitive limits, apply directly to developer tooling.
Different feedback speeds produce fundamentally different developer behaviors:
Feedback time
Developer behavior
Cognitive impact
Under 1 second
Feels instantaneous. The developer stays in flow, treating the test result as part of the editing cycle.2
Working memory is fully intact. The change and the result are experienced as a single action.
1 to 10 seconds
The developer waits. Attention may drift briefly but returns without effort.
Working memory is intact. The developer can act on the result immediately.
10 seconds to 2 minutes
The developer starts to feel the wait. They may glance at another window or check a message, but they do not start a new task.
Working memory begins to decay. Nielsen’s 10-second limit marks the point where attention starts to wander;2 beyond it, each additional second increases the chance of distraction (extrapolated from the same perceptual thresholds).
2 to 10 minutes
The developer context-switches. They check email, review a PR, or start thinking about a different problem. When the result arrives, they must actively return to the original task.
Working memory is partially lost. Rebuilding context takes several minutes depending on the complexity of the change.1
Over 10 minutes
The developer fully disengages and starts a different task. The test result arrives as an interruption to whatever they are now doing.
Working memory of the original change is gone. Rebuilding it takes upward of 23 minutes.1 Investigating a failure means re-reading code they wrote an hour ago.
The conventional 10-minute CI target lines up with the boundary between “developer waits and acts
on the result” and “developer starts something else and pays a full context-switch penalty.”
Below 10 minutes, feedback is actionable. Above 10 minutes, feedback becomes an interruption. The
number itself is an established CD convention rather than a figure the cognitive research
produces directly, but DORA’s research on
continuous integration converges on the same target: tests should complete in under 10 minutes to
support the fast feedback loops that high-performing teams depend on.3
What this means for test architecture
These cognitive breakpoints should drive how you structure your test suite:
Local development (under 1 second). Unit tests for the code you are actively changing should
run in watch mode, re-executing on every save. At this speed, TDD becomes natural - the test
result is part of the writing process, not a separate step. This is where you test complex logic
with many permutations.
Pre-push verification (under 2 minutes). The full unit test suite and the component tests
for the component you changed should complete before you push. At this speed, the developer
stays engaged and acts on failures immediately. This is where you catch regressions.
CI pipeline (under 10 minutes). The full deterministic suite - all unit tests, all component
tests, all contract tests - should complete within 10 minutes of commit. At this speed, the
developer has not yet fully disengaged from the change. If CI fails, they can investigate while
the code is still fresh.
Post-deploy verification (minutes to hours). E2E smoke tests and integration test validation
run after deployment. These are non-deterministic, slower, and less frequent. Failures at this
level trigger investigation, not immediate developer action.
When a test suite exceeds 10 minutes, the solution is not to accept slower feedback. It is to
redesign the suite: replace E2E tests with component tests using test doubles, parallelize test
execution, and move non-deterministic tests out of the gating path.
Impact on application architecture
Test feedback speed is not just a testing concern - it puts pressure on how you design your
systems. A monolithic application with a single test suite that takes 40 minutes to run forces
every developer to pay the full context-switch penalty on every change, regardless of which
module they touched.
Breaking a system into smaller, independently testable components is often motivated as much by
test speed as by deployment independence. When a component has its own focused test suite that
runs in under 2 minutes, the developer working on that component gets fast, relevant feedback.
They do not wait for tests in unrelated modules to finish.
This creates a virtuous cycle: smaller components with clear boundaries produce faster test
suites, which enable more frequent integration, which encourages smaller changes, which are
easier to test. Conversely, a tightly coupled monolith produces a slow, tangled test suite that
discourages frequent integration, which leads to larger changes, which are harder to test and
more likely to fail.
Architecture decisions that improve test feedback speed include:
Clear component boundaries with well-defined interfaces, so each component can be tested
in isolation with test doubles for its dependencies.
Separating business logic from infrastructure so that core rules can be unit tested in
milliseconds without databases, queues, or network calls.
Independently deployable services with their own test suites, so a change to one service
does not require running the entire system’s tests.
Avoiding shared mutable state between components, which forces integration tests and
introduces non-determinism.
If your test suite is slow and you cannot make it faster by optimizing test execution alone, the
architecture is telling you something. A system that is hard to test quickly is also hard to
change safely - and both problems have the same root cause.
The compounding cost of slow feedback
Slow feedback does not just waste time - it changes behavior. When the suite takes 40 minutes,
developers adapt:
They batch changes to avoid running the suite more than necessary, creating larger and riskier
commits.
They stop running tests locally because the wait is unacceptable during active development.
They push to CI and context-switch, paying the full rebuild penalty on every cycle.
They rerun failures instead of investigating, because re-reading the code they wrote an hour
ago is expensive enough that “maybe it was flaky” feels like a reasonable bet.
Each of these behaviors degrades quality independently. Together, they make continuous integration
impossible. A team that cannot get feedback on a change within 10 minutes cannot sustain the
practice of integrating changes multiple times per day.4
Sources
Further reading
Build Duration - Measuring and improving CI pipeline speed
Nicole Forsgren, Jez Humble, and Gene Kim, Accelerate: The Science of Lean Software and DevOps, IT Revolution Press, 2018. ↩︎
3.10 - Testing Antipatterns
Common testing antipatterns that block CD, plus a migration guide for getting an existing suite back on track.
Most teams arrive at this section with a test suite that doesn’t match the Applied Testing Strategies guide. This page covers the failure modes that show up most often and the migration moves that get a suite back on track.
Common testing anti-patterns
Each entry below is a smell that the suite is testing the wrong thing, will erode trust over time, or will block refactoring instead of enabling it.
Reflection to reach private members
Using reflection (or language-equivalent escape hatches: @VisibleForTesting-only public access, friend classes, internal exposed only for tests) to read or invoke private members from a test. This couples the test to the exact internal structure of the class, breaks every time the implementation is refactored, and tests something the caller cannot observe, meaning the test can pass while the actual public behavior is broken.
If a private behavior is worth testing, it’s reachable through a public method that exercises it. If no public method exercises it, the private code is dead and should be deleted. Reflection in tests is a signal that either the design needs adjustment (the class is too large and a collaborator wants to come out) or the test is aimed at the wrong abstraction level.
Testing private methods directly
Same root cause as the reflection anti-pattern, but achieved by making methods package-private, protected, or otherwise reachable through a side door specifically so tests can call them. The method’s accessibility is now distorted by the test, not by the design. Drive private logic through the public method that uses it, or extract it into a collaborator with its own public surface and test that collaborator through its public interface.
One test class per production class, one test per method
Tests organized as a mirror of the production code structure, such as OrderServiceTest with testProcessPayment, testValidateOrder, testEmitEvent, produce a suite that documents the implementation and dies on contact with refactoring. Organize tests by behavior. An OrderPlacement test class with places_order_with_valid_payment, rejects_order_when_payment_declined, holds_order_when_inventory_unavailable is what survives, what reads well, and what catches integration bugs between methods.
Tests that mirror the implementation
A test that asserts “method A is called, then method B is called, then method C is called with these arguments” is testing the implementation, not the behavior. The same outcome could be achieved by a different sequence of calls, and if the test fails when the sequence changes but the outcome doesn’t, the test is wrong, not the code. Assert on observable outcomes (returned value, persisted state, emitted event, response status) and use mocks/spies sparingly, only for outbound interactions that are themselves part of the contract.
Mocking what you don’t own
Stubbing a third-party SDK, ORM, HTTP client, or cloud SDK directly in tests. The double is now a claim about a library the team has no control over and incomplete knowledge of. When the library updates or the team upgrades versions, the doubles are silently wrong and the tests still pass. Wrap third-party clients in a thin gateway the team owns, then double the gateway.
Doubles without validating tests
Any test double that has no corresponding mechanism (contract test, adapter integration test, post-deploy integration check) keeping it honest is a lie waiting to be discovered in production. If a double exists and there’s no traceable answer to “how would we know if this stopped matching reality?” that double is a known risk and should be tracked as one.
Over-mocking
Replacing every collaborator with a mock so the test sees only the system under test in isolation. The test now mirrors the implementation: every refactor that moves a method between collaborators breaks tests that didn’t fail for any production reason. Only mock what’s necessary to keep the test deterministic. Real in-process collaborators - value objects, domain models, in-memory repositories - belong in the test, not behind a mock.
Complex mock setup
If a single test needs dozens of lines to set up its mocks, the system under test probably has too many dependencies for one unit of behavior. Setup complexity is a smell pointing at the production design, not at the test. Refactor the production code (extract a collaborator, narrow the interface, push concerns into separate classes) before adding more mocks.
Sleeping in tests
Thread.sleep, await sleep(500), and friends to “wait for” an asynchronous operation. Sleeps are either too short (flaky) or too long (slow), and they ratchet upward over time as people debug flakes. Use the framework’s built-in waiting primitives (Awaitility, waitFor from Testing Library, eventually blocks) that poll until a condition is true with a bounded timeout. If the system under test depends on real wall-clock time, inject a fake clock. Never sleep.
Shared mutable state between tests
Tests that depend on the order they run in, or that leak state through static singletons, shared databases without per-test isolation, or module-level caches. Each test should set up the state it needs and tear it down (or use a fresh isolated context). Order-dependent suites fail randomly when run in parallel and produce “works on my machine” failures that erode trust in the suite.
Skipping or muting tests instead of fixing them
A muted test is a known bug in the test or in the system, hidden. Either fix it now, delete it, or open a ticket and put a deadline on it. Suites with a steady population of @Ignore/@skip/xit decorations end up with a steady population of latent bugs.
Test code held to lower standards than production code
Copy-pasted setup blocks, string-typed assertions on JSON fragments, magic numbers, no abstractions, no review. Tests are production code. They’re how the team learns whether the system works. Refactor them, deduplicate them, name them well, and review them as carefully as the code they protect.
Testing through the UI when the same behavior is testable lower in the stack
UI tests are the slowest and most fragile layer. Pushing logic-only assertions into UI tests because “that’s where we’re set up to test” produces a brittle, slow suite that becomes a tax on every change. Test logic where the logic lives. Reserve UI tests for things that can only be observed at the UI layer.
“We’ll add tests later”
Tests added after the code is already in production, written by someone who didn’t write the code, asserting only what the code currently does, are not tests of the system’s intended behavior. They’re a snapshot of the current implementation, including its bugs. The team learns nothing from them and refactoring becomes risky in exactly the way tests are supposed to prevent. Tests written alongside the code (or before it, TDD-style) are the only ones that document intent.
Migrating an existing suite
The right first move depends on what the suite looks like now. Five common starting points and the first three steps for each:
If most coverage is end-to-end Selenium or Cypress against real backends
Inventory the flows the E2E suite exercises. Pick the top five that fail most often.
Build component tests for those flows. Double the backend through the gateway the team owns.
Once those component tests are green and the doubles they rely on are backed by a contract test plus an out-of-band check that is actually running and watched, delete the corresponding E2E tests. Don’t keep both: duplicated coverage doubles the maintenance cost without doubling the confidence. Until that out-of-band validation is in place and monitored, keep one real-integration smoke test per flow - the component test’s confidence rests on doubles, and deleting the last real-integration signal before anything proves those doubles still match reality just moves the risk somewhere you can’t see it.
If most “unit” tests mock third-party SDKs
Identify the third-party clients (HTTP, DB, cloud SDKs). For each, define a thin gateway interface owned by the team.
Replace direct SDK use in production code with the gateway. Tests now double the gateway, which the team controls.
Add adapter integration tests against the real dependency (testcontainer, sandbox account). The doubles are now backed by reality.
If line coverage is high but production keeps breaking
Run mutation testing on a high-traffic module. Most surviving mutants are tests that didn’t catch the mutation.
For each surviving mutant, add a flow-oriented test that would have caught it. Don’t add a test of the specific mutation: add the test of the behavior the mutation breaks.
Repeat module by module, prioritized by production incident frequency. Coverage % won’t change much. Defect-finding will.
If the suite has six figures of tests and runs for 90 minutes
Move tests that need a database or downstream into an integration lane on a different cadence (post-merge or scheduled), not the pre-commit gate.
Convert sociable unit tests to component tests where they exercise complete flows. Delete redundant unit-level duplicates.
Set a budget: deterministic suite under 10 minutes. Non-conforming tests get reviewed; if they can’t be made fast, they move to acceptance or get deleted.
If there are no tests at all
Don’t try to retrofit unit tests for existing code. You’ll write tests that pin the current bugs.
Start with a small set of component tests for the highest-value flows. They double as characterization tests for legacy behavior.
As the team changes code, write tests for the change first. The test base grows organically with the change set, and the parts of the code that change most are the parts that get tests soonest.
The pattern across all five: don’t try to convert the whole suite at once. Move flow by flow, module by module. The test that matters next is the one for the change you’re about to make.
Test Double - the glossary entry covering the five flavours and when to use each.
3.11 - Testing Glossary
Definitions for testing terms as they are used on this site.
These definitions reflect how this site uses each term. They are not universal definitions -
other communities may use the same words differently.
Acceptance Tests
Automated tests that verify a system behaves as specified. Acceptance tests
exercise user workflows in a
production-like environment and confirm the implementation
matches the acceptance criteria. They answer “did we build what was specified?” rather than
“does the code work?” They do not validate whether the specification itself is correct -
only real user feedback can confirm we are building the right thing.
In CD, acceptance testing is a pipeline stage, not a single test type. It can include
component tests, load tests, chaos tests, resilience tests, and compliance tests. Any test
that runs after CI to gate promotion to production is an acceptance test.
A narrow test of a single boundary adapter - the team’s own HTTP client, database query layer, message-broker client, file-system adapter, or similar - exercised against either the real external dependency or a high-fidelity stand-in like a testcontainer running the production engine. (Legacy name from Toby Clemson: “gateway integration test.”)
What the test is for
The test asserts that the adapter correctly speaks the protocol: that it serializes the request the way the dependency expects, parses the response shape correctly, maps errors to the right exception types, propagates headers, enforces timeouts, and handles transactional semantics.
What the test is not for
It does not test the behavior of the dependency itself. If the adapter asks for a user, the test validates that the response parses into a valid User object - not which user comes back, not the dependency’s own business rules, not anything that the dependency owns. The dependency’s correctness is the dependency’s problem; the adapter’s job is to speak the protocol faithfully. Conflating the two produces brittle tests that fail on unrelated changes to the dependency’s data or logic.
The team has full control over the dependency - a database, broker, or service the team owns and can pin to a known version, typically via a per-test testcontainer.
The test is fully deterministic against that controlled instance.
For everything else - third-party APIs, services owned by another team, dependencies whose state the team can’t reset between runs - the test runs out-of-band on a schedule. Out-of-band placement is the default for any adapter test that touches a system outside the team’s full control. Failures trigger review, not a build break. Pulling these tests in-band is the most common cause of flaky pipelines.
Distinguishing from neighboring test types
Different from a broader end-to-end test: an adapter integration test isolates one boundary adapter, not a flow across multiple components. Different from a contract test at the same boundary: contract tests pin shape against doubles in the pipeline; adapter integration tests pin protocol against the real dependency.
A test that pins the public-facing API of a library or CLI - the exported symbols, their signatures, the documented arguments and exit codes. Typically a snapshot: the current public surface is captured to a file, and any diff fails the build. Catches accidental breaking changes (a renamed function, a removed flag, a tightened type) before they reach consumers. Distinct from a contract test, which pins the wire boundary between two services; an API surface test pins the source-level boundary between a library and its callers.
A testing approach where the test exercises code through its public interface and asserts
only on observable outputs - return values, state changes visible to consumers, or side
effects such as messages sent. The test has no knowledge of internal implementation details.
Black box tests are resilient to refactoring because they verify what the code does, not
how it does it. Contrast with white box testing.
A test that exercises a stateful service across multiple nodes - replication, leader election, consensus, partition tolerance - against a real multi-node setup, typically via testcontainers running the production consensus library. Cluster tests catch behavior that only appears under a real cluster: split-brain, slow followers, leader transitions, partition reconciliation. Deterministic enough to run in-band but slower than single-node component tests, so usually relegated to a later CI stage.
A CI configuration that runs the existing test suite on each supported operating system rather than a separate test type. The matrix catches platform-specific behavior single-OS tests can’t: path separators, line endings, signal-handling differences, locale defaults, file-system case sensitivity. Required for any deployable consumed across multiple OSes - CLI tools, libraries, cross-platform desktop or mobile apps.
A test that invokes the actual deployed artifact - the same binary, container image, or package the scheduler, orchestrator, or operator will invoke in production - and asserts on observable behavior at startup or first invocation. Catches what in-process component tests bypass: configuration loading, secret resolution, signal handling, exit codes, lock acquisition, dependency-version mismatches. Usually a small set; the bulk of behavior is tested in component tests against an in-memory assembled app.
An executable test extracted from documentation - typically the README or inline code samples - that runs the documented examples against the real binary or library and fails the build if the examples are broken. Doctests close the gap between “the docs say X works” and “X actually works in the latest build”. Most languages have framework support: Python’s doctest module, Rust’s #[doc] attribute, and Markdown-based runners for Node and Java.
A test that runs in the delivery pipeline as part of the commit-to-deploy flow. In-band tests must be deterministic, which means test doubles replace anything that crosses the component boundary - downstream services, message brokers, schedulers, browsers talking to real backends. Failures block the build or the deployment.
The bulk of any project’s test suite is in-band: unit tests, component tests, contract tests, and adapter integration tests against team-controlled dependencies (testcontainers running an engine the team pins). Adapter integration tests against third-party services or shared environments run out-of-band on a schedule, not in-band. They give a deterministic go/no-go signal in minutes.
Contrast with out-of-band tests, which run on a schedule against real systems and never gate the build.
A test that runs outside the delivery pipeline on a schedule or post-deploy, exercising real external systems. Out-of-band tests are non-deterministic by design (they depend on the real world) and never gate a commit or merge. Failures trigger review, alerts, or rollback decisions.
Out-of-band checks are how teams confirm that the doubles used by in-band tests still match reality. Examples: post-deploy integration tests against the real downstream, synthetic monitoring of production, scheduled smoke checks against a sandbox API.
A long-running test that exercises a deployed service for hours or days under representative load to catch behavior that only appears with time: memory leaks, unbounded growth, replication-lag drift, slow-burn resource exhaustion. Soak tests are out-of-band by design - they don’t fit a pre-merge budget. Failures trigger review, not a build break. Often paired with chaos testing (deliberate fault injection during the soak) to validate recovery behavior over time.
A unit test that allows real collaborator objects to participate -
for example, a service object calling a real domain model or value object - while still
replacing any external I/O (network, database, file system) with test doubles. The “unit”
being tested is a behavior that spans multiple in-process objects. When the scope expands
to the entire public interface of a frontend component or backend service, that is a
component test.
A unit test that replaces all collaborators with
test doubles and exercises a single class or function in complete isolation.
Contrast with sociable unit test, which allows real collaborator objects
while still replacing external I/O.
Automated scripts that continuously execute realistic user journeys or API calls against a
live production (or production-like) environment and alert when those journeys fail or degrade.
Unlike passive monitoring that watches for errors in real user traffic, synthetic monitoring
proactively simulates user behavior on a schedule - so problems are detected even during low
traffic periods. Synthetic monitors are non-deterministic (they depend on live external systems)
and are never a pre-merge gate. Failures trigger alerts or rollback decisions, not build blocks.
A development practice where tests are written before the production code that makes them
pass. TDD supports CD by ensuring high test coverage, driving simple design, and producing
a fast, reliable test suite. TDD feeds into the testing fundamentals
required in Phase 1.
A stand-in object that replaces a real production dependency during testing. The term comes from the film industry’s “stunt double”: just as a stunt double replaces an actor for dangerous scenes, a test double replaces a costly or non-deterministic dependency to make tests fast, isolated, and reliable.
Test doubles let you:
Remove non-determinism by replacing network calls, databases, and file systems with predictable substitutes.
Control test conditions by forcing specific states, error conditions, or edge cases that would be hard to reproduce with real dependencies.
Increase speed by eliminating slow I/O.
Isolate the system under test so failures point at the code being tested, not at an external dependency.
Types of test doubles
Type
Description
Example use case
Dummy
Passed around but never actually used. Fills parameter lists.
A required logger parameter in a constructor.
Stub
Provides canned answers to calls made during the test. Does not respond to anything outside what is programmed.
Returning a fixed user object from a repository.
Spy
A stub that also records information about how it was called (arguments, call count, order).
Verifying that an analytics event was sent once.
Mock
Pre-programmed with expectations about which calls will be made. Verification happens on the mock itself.
Asserting that sendEmail() was called with specific arguments.
Fake
Has a working implementation, but takes shortcuts not suitable for production.
An in-memory database replacing PostgreSQL.
Choosing the right double
Use a stub when you need to supply data but don’t care how it was requested.
Use a spy when you need to verify call arguments or call count.
Use a mock when the interaction itself is the primary thing being verified.
Use a fake when you need realistic behavior but can’t use the real system.
Use a dummy when a parameter is required by the interface but irrelevant to the test.
Test doubles are heaviest in the early pipeline stages (unit, component, contract tests) where deterministic speed is the priority. They thin out as you move through the pipeline; end-to-end tests use no doubles by design. The guiding principle from Justin Searls: “Don’t poke too many holes in reality.” Use a double when you must, and prefer the real implementation when it’s fast and deterministic.
Doubles are only as good as the contract they encode. Every double in the suite should trace to a contract test pinning its claims and an out-of-band check confirming the claims still hold. See the Antipatterns page for the failure modes of unvalidated doubles.
A test double that simulates a real external service over the network, responding to HTTP
requests with pre-configured or recorded responses. Unlike in-process stubs or mocks, a
virtual service runs as a standalone process and is accessed via real network calls, making
it suitable for component testing and end-to-end testing where your application needs to
make actual HTTP requests against a dependency. Service virtualization tools can create
virtual services from recorded traffic or API specifications. See
Test Doubles.
A testing approach where the test has knowledge of and asserts on internal implementation
details - specific methods called, call order, internal state, or code paths taken. White
box tests verify how the code works, not what it produces. These tests are fragile
because any refactoring of internals breaks them, even when behavior is unchanged. Avoid
white box testing in unit tests; prefer black box testing that asserts
on observable outcomes.
Automate your build process so a single command builds, tests, and packages your application.
Phase 1 - Foundations | Scope: Team
Build automation is the single-command loop that makes CI possible. If you cannot build, test, and package with one command, you cannot automate your pipeline.
What Build Automation Means
A single command (or CI trigger) executes the entire sequence from source code to deployableartifact:
Compile the source code (if applicable)
Run all automated tests
Package the application into a deployable artifact (container image, binary, archive)
Report the result (pass or fail, with details)
No manual steps. No “run this script, then do that.” No tribal knowledge about which flags to set or which order to run things. One command, every time, same result.
The Litmus Test
Ask yourself: “Can a new team member clone the repository and produce a deployable artifact with a single command within 15 minutes?”
If the answer is no, your build is not fully automated.
Why Build Automation Matters for CD
Without build automation, every other practice in this guide breaks down. You cannot have continuous integration if the build requires manual intervention. You cannot have a deterministic pipeline if the build produces different results depending on who runs it.
Anti-pattern: Build instructions that exist only in a wiki, a Confluence page, or one developer’s head. If the build steps are not in the repository, they will drift from reality.
2. Dependency Management
All dependencies must be declared explicitly and resolved deterministically.
Practices:
Lock files: Use lock files (package-lock.json, Pipfile.lock, go.sum) to pin exact dependency versions. Check lock files into version control.
Reproducible resolution: Running the dependency install twice should produce identical results.
No undeclared dependencies: Your build should not rely on tools or libraries that happen to be installed on the build machine. If you need it, declare it.
Dependency scanning: Automate vulnerability scanning of dependencies as part of the build. Do not wait for a separate security review.
Anti-pattern: “It builds on Jenkins because Jenkins has Java 11 installed, but the Dockerfile uses Java 17.” The build must declare and control its own runtime.
3. Build Caching
Fast builds keep developers in flow. Caching is the primary mechanism for build speed.
What to cache:
Dependencies: Download once, reuse across builds. Most build tools (npm, Maven, Gradle, pip) support a local cache.
Docker layers: Structure your Dockerfile so that rarely-changing layers (OS, dependencies) are cached and only the application code layer is rebuilt.
Test fixtures: Prebuilt test data or container images used by tests.
Guidelines:
Cache aggressively for local development and CI
Invalidate caches when dependencies or build configuration change
Never cache test results. Tests must always run
4. Single Build Script Entry Point
Developers, CI, and CD should all use the same entry point.
Makefile as single build entry point
# Example: Makefile as the single entry point

.PHONY: build test package all

all: build test package

build:
	./gradlew compileJava

test:
	./gradlew test

package:
	docker build -t myapp:$(GIT_SHA) .

clean:
	./gradlew clean
	docker rmi myapp:$(GIT_SHA) || true
The CI server runs make all. A developer runs make all. The result is the same. There is no separate “CI build script” that diverges from what developers run locally.
5. Artifact Versioning
Every build artifact must be traceable to the exact commit that produced it.
Practices:
Tag artifacts with the Git commit SHA or a build number derived from it
Store build metadata (commit, branch, timestamp, builder) in the artifact or alongside it
Never overwrite an existing artifact. If the version exists, the artifact is immutable
The CI server is the mechanism that runs your build automatically.
What the CI Server Does
Watches the trunk for new commits
Runs the build (the same command a developer would run locally)
Reports the result (pass/fail, test results, build duration)
Notifies the team if the build fails
Minimum CI Configuration
Regardless of which CI tool you use (GitHub Actions, GitLab CI, Jenkins, CircleCI), the configuration follows the same pattern:
Conceptual minimum CI configuration
# Conceptual CI configuration (adapt to your tool)trigger:branch: main # Run on every commit to trunksteps:-checkout: source code
-install: dependencies
-run: build
-run: tests
-run: package
-report: test results and build status
CI Principles for Phase 1
Run on every commit. Not nightly, not weekly, not “when someone remembers.” Every commit to trunk triggers a build.
Treat a failing build as the team’s top priority. Stop work until trunk is green again. (See Working Agreements.)
Run the same build everywhere. Use the same script in CI and local development. No CI-only steps that developers cannot reproduce.
Fail fast. Run the fastest checks first (compilation, unit tests) before the slower ones (integration tests, packaging).
Build Time Targets
Build speed directly affects developer productivity and integration frequency. If the build takes 30 minutes, developers will not integrate multiple times per day.
Build Phase
Target
Rationale
Compilation
< 1 minute
Developers need instant feedback on syntax and type errors
Unit tests
< 3 minutes
Fast enough to run before every commit
Integration tests
< 5 minutes
Must complete before the developer context-switches
Full build (compile + test + package)
< 10 minutes
The outer bound for fast feedback
If Your Build Is Too Slow
Slow builds are a common constraint that blocks CD adoption. Address them systematically:
Profile the build. Identify which steps take the most time. Optimize the bottleneck, not everything.
Parallelize tests. Most test frameworks support parallel execution. Run independent test suites concurrently.
Use build caching. Avoid recompiling or re-downloading unchanged dependencies.
Split the build. Run fast checks (lint, compile, unit tests) as a “fast feedback” stage. Run slower checks (integration tests, security scans) as a second stage.
Upgrade build hardware. Sometimes the fastest optimization is more CPU and RAM.
Common Anti-Patterns
Anti-pattern
Impact
Fix
Manual build steps
Error-prone, slow, and impossible to parallelize or cache.
Script every step so no human intervention is required.
Environment-specific builds
You are not testing the same artifact you deploy, making production bugs impossible to diagnose.
Build one artifact and configure it per environment at deployment time. (See Application Config.)
Build scripts that only run in CI
Developers cannot reproduce CI failures locally, leading to slow debugging cycles.
Use a single build entry point that both CI and developers use.
Missing dependency pinning
The build is non-deterministic; the same code can produce different results on different days.
Use lock files and pin all dependency versions.
Long build queues
Delayed feedback defeats the purpose of CI because developers context-switch before seeing results.
Ensure CI infrastructure can handle your commit frequency with parallel build agents.
With build automation in place, you can build, test, and package your application reliably. The next foundation is ensuring that the work you integrate daily is small enough to be safe. Continue to Work Decomposition.
Related Content
Slow Pipelines: symptom caused by unoptimized or missing build automation
Works on My Machine: symptom eliminated when the build runs the same everywhere
Everything as Code: companion guide for versioning build scripts, pipelines, and infrastructure
Build Duration: metric for tracking build speed improvements
5 - Work Decomposition
Break features into small, deliverable increments that can be completed in 2 days or less.
Phase 1 - Foundations | Scope: Team
Trunk-based development requires daily integration, and daily integration requires small work. This page covers the techniques for breaking work into small, deliverable increments that flow through your pipeline continuously.
Why Small Work Matters for CD
Continuous delivery depends on a core principle: small changes, integrated frequently, are safer than large changes integrated rarely.
Every practice in Phase 1 reinforces this:
Trunk-based development requires that you integrate at least daily. You cannot integrate a two-week feature daily unless you decompose it.
Testing fundamentals work best when each change is small enough to test thoroughly.
Code review is fast when the change is small. A 50-line change can be reviewed in minutes. A 2,000-line change takes hours - if it gets reviewed at all.
The DORA research consistently shows that smaller batch sizes correlate with higher delivery performance. Small changes have:
Lower risk: If a small change breaks something, the blast radius is limited, and the cause is obvious.
Faster feedback: A small change gets through the pipeline quickly. You learn whether it works today, not next week.
Easier rollback: Rolling back a 50-line change is straightforward. Rolling back a 2,000-line change often requires a new deployment.
Better flow: Small work items move through the system predictably. Large work items block queues and create bottlenecks.
The 2-Day Rule
If a work item takes longer than 2 days to complete, it is too big.
Two days gives you at least one integration to trunk per day (the minimum for TBD) and allows for the natural rhythm of development: plan, implement, test, integrate, move on.
When a developer says “this will take a week,” the answer is not “go faster.” The answer is “break it into smaller pieces.”
What “Complete” Means
A work item is complete when it is:
Integrated to trunk
All tests pass
The change is deployable (even if the feature is not yet user-visible)
The most important slicing technique for CD is vertical slicing: cutting through all layers of the application to deliver a thin but complete slice of functionality.
Vertical slice (correct):
“As a user, I can log in with my email and password.”
This slice touches the UI (login form), the API (authentication endpoint), and the database (user lookup). It is deployable and testable end-to-end.
Horizontal slice (anti-pattern):
“Build the database schema for user accounts.”
“Build the authentication API.”
“Build the login form UI.”
Each horizontal slice is incomplete on its own. None is deployable. None is testable end-to-end. They create dependencies between work items and block flow.
Vertical slicing in distributed systems
Not every team owns the full stack from UI to database. A subdomain product team may own a service whose consumers are other services, not humans. The principle still applies: a vertical slice cuts through all layers your team owns and delivers complete, observable behavior through your team’s public interface.
Does this change deliver complete behavior through the interface your team owns? For a full-stack product team, that interface is a UI. For a subdomain team, it is an API contract. If the change only touches one layer beneath that interface, it is a horizontal slice regardless of how you label it.
See Horizontal Slicing for how layer-by-layer splitting fails in distributed systems.
Slicing Strategies
When a story feels too big, apply one of these strategies:
Strategy
How It Works
Example
By workflow step
Implement one step of a multi-step process
“User can add items to cart” (before “user can checkout”)
By business rule
Implement one rule at a time
“Orders over $100 get free shipping” (before “orders ship to international addresses”)
“Create a new customer” (before “edit customer” or “delete customer”)
By performance
Get it working first, optimize later
“Search returns results” (before “search returns results in under 200ms”)
By platform
Support one platform first
“Works on desktop web” (before “works on mobile”)
Happy path first
Implement the success case first
“User completes checkout” (before “user sees error when payment fails”)
Example: Decomposing a Feature
Original story (too big):
“As a user, I can manage my profile including name, email, avatar, password, notification preferences, and two-factor authentication.”
Decomposed into vertical slices:
“User can view their current profile information” (read-only display)
“User can update their name” (simplest edit)
“User can update their email with verification” (adds email flow)
“User can upload an avatar image” (adds file handling)
“User can change their password” (adds security validation)
“User can configure notification preferences” (adds preferences)
“User can enable two-factor authentication” (adds 2FA flow)
Each slice is independently deployable, testable, and completable within 2 days.
Use BDD scenarios to find slice boundaries
BDD scenarios are the most reliable way to find slice boundaries. Each Given-When-Then scenario becomes a candidate work item with clear scope and testable acceptance criteria. A brief “Three Amigos” conversation (business, development, testing perspectives) before work begins surfaces these scenarios naturally.
Given-When-Then: user login scenarios
Feature: User login

  Scenario: Successful login with valid credentials
    Given a registered user with email "user@example.com"
    When they enter their correct password and click "Log in"
    Then they are redirected to the dashboard

  Scenario: Failed login with wrong password
    Given a registered user with email "user@example.com"
    When they enter an incorrect password and click "Log in"
    Then they see the message "Invalid email or password"
    And they remain on the login page
Each scenario is a natural unit of work. Implement one scenario at a time, integrate to trunk after each one.
Task Decomposition Within Stories
Even well-sliced stories may contain multiple tasks. Decompose stories into tasks that can be completed and integrated independently.
Example story: “User can update their name”
Tasks:
Display the current name on the profile page (read-only, end-to-end through UI and API, integration test)
Add an editable name field that saves successfully (UI, API, and persistence in one pass, E2E test)
Show a validation error when the name is blank (adds one business rule across all layers, unit and E2E test)
Each task delivers a thin vertical slice of behavior and results in a commit to trunk. The story is completed through a series of small integrations, not one large merge.
Guidelines for task decomposition:
Each task should take hours, not days
Each task should leave trunk in a working state after integration
Tasks should be ordered so that the simplest changes come first
If a task requires a feature flag or stub to be integrated safely, that is fine
Common Anti-Patterns
Horizontal Slicing: Stories organized by layer (“build the schema,” “build the API,” “build the UI”). No individual slice is deployable.
Monolithic Work Items: Stories with 10+ acceptance criteria or multi-week estimates. Break them into smaller stories using the slicing strategies above.
Technical stories without business context: Backlog items like “refactor the database access layer” that do not tie to a business outcome. Embed technical improvements in feature stories and keep them under 2 days.
Splitting by role instead of by behavior: Separate stories for “frontend developer builds the UI” and “backend developer builds the API” create handoff dependencies and delay integration. Write stories from the user’s perspective so the same developer (or pair) implements the full vertical slice.
Deferring edge cases indefinitely: Building the happy path and creating a backlog of “handle error case X” stories that never get prioritized. Error handling is not optional. Include the most important error cases in the initial decomposition and schedule them immediately after the happy path, not “someday.”
Streamline code review to provide fast feedback without blocking flow.
Phase 1 - Foundations | Scope: Team
Code review is essential for quality, but it is also the most common bottleneck in teams adopting trunk-based development. If reviews take days, daily integration is impossible. This page covers review techniques that maintain quality while enabling the flow that CD requires.
Why Code Review Matters for CD
Automated tools catch syntax errors, style violations, and known vulnerability patterns. Code review exists for the things automation cannot evaluate.
Cognitive load and maintainability: Tools can count complexity points, but they cannot judge whether the logic is intuitive. A human reviewer catches over-engineered abstractions and code that will confuse a teammate maintaining it at 3:00 AM.
Systemic context: Static analysis sees the code but does not remember the past. A peer reviewer remembers that Service X handles retries poorly and can spot an implementation that is technically correct but will trigger a known systemic weakness. Reviewers also verify that the solution aligns with the platform’s long-term architectural direction.
Knowledge distribution: If the author is the only person who understands a critical path, the team is at risk. Review ensures at least one other person shares that context. It is also the primary mechanism for cross-pollinating new patterns and domain knowledge across the team.
Novel security and logic bypasses: Automation catches known patterns like SQL injection. It often misses logical security flaws - for example, a change to a discount calculation that accidentally allows a negative total. Human reviewers also verify that the developer did not take a dangerous shortcut that bypasses a policy not yet codified in the pipeline.
These are real benefits. The challenge is that traditional code review - open a pull request, wait for someone to review it, address comments, wait again - is too slow for CD.
In a CD workflow, code review must happen within minutes or hours, not days. The review is still rigorous, but the process is designed for speed.
The Core Tension: Quality vs. Flow
Traditional teams optimize review for thoroughness: detailed comments, multiple reviewers, extensive back-and-forth. This produces high-quality reviews but blocks flow.
CD teams optimize review for speed without sacrificing the quality that matters. The key insight is that most of the quality benefit of code review comes from small, focused reviews done quickly, not from exhaustive reviews done slowly.
Traditional Review
CD-Compatible Review
Review happens after the feature is complete
Review happens continuously throughout development
Large diffs (hundreds or thousands of lines)
Small diffs (< 200 lines, ideally < 50)
Multiple rounds of feedback and revision
One round, or real-time feedback during pairing
Review takes 1-3 days
Review takes minutes to a few hours
Review is asynchronous by default
Review is synchronous by preference
2+ reviewers required
1 reviewer (or pairing as the review)
Synchronous vs. Asynchronous Review
Synchronous Review (Preferred for CD)
In synchronous review, the reviewer and author are engaged at the same time. Feedback is immediate. Questions are answered in real time. The review is done when the conversation ends.
Methods:
Pair programming: Two developers work on the same code at the same time. Review is continuous. There is no separate review step because the code was reviewed as it was written.
Mob programming: The entire team (or a subset) works on the same code together. Everyone reviews in real time.
Over-the-shoulder review: The author walks the reviewer through the change in person or on a video call. The reviewer asks questions and provides feedback immediately.
Advantages for CD:
Zero wait time between “ready for review” and “review complete”
Higher bandwidth communication (tone, context, visual cues) catches more issues
Immediate resolution of questions - no async back-and-forth
Knowledge transfer happens naturally through the shared work
Asynchronous Review (When Necessary)
Sometimes synchronous review is not possible - time zones, schedules, or team preferences may require asynchronous review. This is fine, but it must be fast.
Rules for async review in a CD workflow:
Review within 2 hours. If a pull request sits for a day, it blocks integration. Set a team working agreement: “pull requests are reviewed within 2 hours during working hours.”
Keep changes small. A 50-line change can be reviewed in 5 minutes. A 500-line change takes an hour and reviewers procrastinate on it.
Use draft PRs for early feedback. If you want feedback on an approach before the code is complete, open a draft PR. Do not wait until the change is “perfect.”
Avoid back-and-forth. If a comment requires discussion, move to a synchronous channel (call, chat). Async comment threads that go 5 rounds deep are a sign the change is too large or the design was not discussed upfront.
Review Techniques Compatible with TBD
Pair Programming as Review
When two developers pair on a change, the code is reviewed as it is written. There is no separate review step, no pull request waiting for approval, and no delay to integration.
How it works with TBD:
Two developers sit together (physically or via screen share)
They discuss the approach, write the code, and review each other’s decisions in real time
When the change is ready, they commit to trunk together
Both developers are accountable for the quality of the code
When to pair:
New or unfamiliar areas of the codebase
Changes that affect critical paths
When a junior developer is working on a change (pairing doubles as mentoring)
Any time the change involves design decisions that benefit from discussion
Pair programming satisfies most organizations’ code review requirements because two developers have actively reviewed and approved the code.
Mob Programming as Review
Mob programming extends pairing to the whole team. One person drives (types), one person navigates (directs), and the rest observe and contribute.
When to mob:
Establishing new patterns or architectural decisions
Complex changes that benefit from multiple perspectives
Onboarding new team members to the codebase
Working through particularly difficult problems
Mob programming is intensive but highly effective. Every team member understands the code, the design decisions, and the trade-offs.
Rapid Async Review
For teams that use pull requests, rapid async review adapts the pull request workflow for CD speed.
Practices:
Auto-assign reviewers. Do not wait for someone to volunteer. Use tools to automatically assign a reviewer when a PR is opened.
Keep PRs small. Target < 200 lines of changed code. Smaller PRs get reviewed faster and more thoroughly.
Provide context. Write a clear PR description that explains what the change does, why it is needed, and how to verify it. A good description reduces review time dramatically.
Use automated checks. Run linting, formatting, and tests before the human review. The reviewer should focus on logic and design, not style.
Approve and merge quickly. If the change looks correct, approve it. Do not hold it for nitpicks. Nitpicks can be addressed in a follow-up commit.
What to Review
Not everything in a code change deserves the same level of scrutiny. Focus reviewer attention where it matters most.
High Priority (Reviewer Should Focus Here)
Behavior correctness: Does the code do what it is supposed to do? Are edge cases handled?
Security: Does the change introduce vulnerabilities? Are inputs validated? Are secrets handled properly?
Clarity: Can another developer understand this code in 6 months? Are names clear? Is the logic straightforward?
Test coverage: Are the new behaviors tested? Do the tests verify the right things?
API contracts: Do changes to public interfaces maintain backward compatibility? Are they documented?
Error handling: What happens when things go wrong? Are errors caught, logged, and surfaced appropriately?
Low Priority (Automate Instead of Reviewing)
Code style and formatting: Use automated formatters (Prettier, Black, gofmt). Do not waste reviewer time on indentation and bracket placement.
Import ordering: Automate with linting rules.
Naming conventions: Enforce with lint rules where possible. Only flag naming in review if it genuinely harms readability.
Unused variables or imports: Static analysis tools catch these instantly.
Consistent patterns: Where possible, encode patterns in architecture decision records and lint rules rather than relying on reviewers to catch deviations.
Rule of thumb: If a style or convention issue can be caught by a machine, do not ask a human to catch it. Reserve human attention for the things machines cannot evaluate: correctness, design, clarity, and security.
Review Scope for Small Changes
In a CD workflow, most changes are small - tens of lines, not hundreds. This changes the economics of review.
Change Size
Expected Review Time
Review Depth
< 20 lines
2-5 minutes
Quick scan: is it correct? Any security issues?
20-100 lines
5-15 minutes
Full review: behavior, tests, clarity
100-200 lines
15-30 minutes
Detailed review: design, contracts, edge cases
> 200 lines
Consider splitting the change
Large changes get superficial reviews
Research consistently shows that reviewer effectiveness drops sharply after 200-400 lines. If you are regularly reviewing changes larger than 200 lines, the problem is not the review process - it is the work decomposition.
Working Agreements for Review SLAs
Establish clear team agreements about review expectations. Without explicit agreements, review latency will drift based on individual habits.
Recommended Review Agreements
Agreement
Target
Response time
Review within 2 hours during working hours
Reviewer count
1 reviewer (or pairing as the review)
PR size
< 200 lines of changed code
Blocking issues only
Only block a merge for correctness, security, or significant design issues
Nitpicks
Use a “nit:” prefix. Nitpicks are suggestions, not merge blockers
Stale PRs
PRs open for > 24 hours are escalated to the team
Self-review
Author reviews their own diff before requesting review
How to Enforce Review SLAs
Track review turnaround time. If it consistently exceeds 2 hours, discuss it in retrospectives.
Make review a first-class responsibility, not something developers do “when they have time.”
If a reviewer is unavailable, any other team member can review. Do not create single-reviewer dependencies.
Consider pairing as the default and async review as the exception. This eliminates the review bottleneck entirely.
Code Review and Trunk-Based Development
Code review and TBD work together, but only if review does not block integration. Here is how to reconcile them:
TBD Requirement
How Review Adapts
Integrate to trunk at least daily
Reviews must complete within hours, not days
Branches live < 24 hours
PRs are opened and merged within the same day
Trunk is always releasable
Reviewers focus on correctness, not perfection
Small, frequent changes
Small changes are reviewed quickly and thoroughly
If your team finds that review is the bottleneck preventing daily integration, the most effective solution is to adopt pair programming. It eliminates the review step entirely by making review continuous.
Measuring Success
Metric
Target
Why It Matters
Review turnaround time
< 2 hours
Prevents review from blocking integration
PR size (lines changed)
< 200 lines
Smaller PRs get faster, more thorough reviews
PR age at merge
< 24 hours
Aligns with TBD branch age constraint
Review rework cycles
< 2 rounds
Multiple rounds indicate the change is too large or design was not discussed upfront
Next Step
Code review practices need to be codified in team agreements alongside other shared commitments. Continue to Working Agreements to establish your team’s definitions of done, ready, and CI practice.
Establish shared definitions of done and ready to align the team on quality and process.
Phase 1 - Foundations | Scope: Team
The practices in Phase 1 (trunk-based development, testing, small work, and fast review) only work when the whole team commits to them. Working agreements make that commitment explicit. This page covers the key agreements a team needs before moving to pipeline automation in Phase 2.
Why Working Agreements Matter
A working agreement is a shared commitment that the team creates, owns, and enforces together. No one imposes it from outside. The team answers one question for itself: “How do we work together?”
Without working agreements, CD practices drift. One developer integrates daily; another keeps a branch for a week. One developer fixes a broken build immediately; another waits until after lunch. These inconsistencies compound. Within weeks, the team is no longer practicing CD. They are practicing individual preferences.
Working agreements prevent this drift by making expectations explicit. When everyone agrees on what “done” means, what “ready” means, and how CI works, the team can hold each other accountable without conflict.
Definition of Done
The Definition of Done (DoD) is the team’s shared standard for when a work item is complete. For CD, done means delivered to the end user.
Minimum Definition of Done for CD
A work item is done when all of the following are true:
Code is integrated to trunk
All automated tests pass
Code has been reviewed (via pairing, mob, or pull request)
The change is delivered to the end user (or deployable to production at any time)
No known defects are introduced
Relevant documentation is updated (API docs, runbooks, etc.)
Feature flags are in place for incomplete user-facing features
Why “Delivered to the End User” Matters
Many teams define “done” as “code is merged.” This creates a gap between “done” and “delivered.” Work accumulates in a staging environment, waiting for a release. Risk grows with each unreleased change.
In a CD organization, “done” means the change has reached the end user (or is ready to reach them at any time). This is the ultimate test of completeness: the change works in the real environment, with real data, under real load.
In Phase 1, you may not yet have the pipeline to deliver every change automatically. That is fine. Your DoD should still include “delivered to the end user” as the standard, even if the delivery step is not yet automated. The pipeline work in Phase 2 will close that gap.
Extending Your Definition of Done
As your CD maturity grows, extend the DoD:
Phase
Addition to DoD
Phase 1 (Foundations)
Code integrated to trunk, tests pass, reviewed, deployable
The Definition of Ready (DoR) answers: “When is a work item ready to be worked on?”
Pulling unready work into development creates waste. Unclear requirements lead to rework. Missing acceptance criteria lead to untestable changes. Oversized stories lead to long-lived branches.
Minimum Definition of Ready for CD
A work item is ready when all of the following are true:
Acceptance criteria are defined and specific (using Given-When-Then or equivalent)
The work item is small enough to complete in 2 days or less
The work item is testable (the team knows how to verify it works)
Dependencies are identified and resolved (or the work item is independent)
The team has discussed the work item (Three Amigos or equivalent)
The work item is estimated (or the team has agreed estimation is unnecessary for items this small)
Common Mistakes with Definition of Ready
Making it too rigid. The DoR is a guideline, not a gate. If the team agrees a work item is understood well enough, it is ready. Do not use the DoR to avoid starting work.
Requiring design documents. For small work items (< 2 days), a conversation and acceptance criteria are sufficient. Formal design documents are for larger initiatives.
Skipping the conversation. The DoR is most valuable as a prompt for discussion, not as a checklist. The Three Amigos conversation matters more than the checkboxes.
CI Working Agreement
The CI working agreement codifies how the team practices continuous integration. Every other agreement depends on a working CI process, making this the foundation the rest builds on.
The CI Agreement
The team agrees to the following practices:
Integration:
Every developer integrates to trunk at least once per day
Branches (if used) live for less than 24 hours
No long-lived feature, development, or release branches
Build:
All tests must pass before merging to trunk
The build runs on every commit to trunk
Build results are visible to the entire team
Broken builds:
A broken build is the team’s top priority. It is fixed before any new work begins
The developer(s) who broke the build are responsible for fixing it immediately
If the fix will take more than 10 minutes, revert the change and fix it offline
No one commits to a broken trunk (except to fix the break)
Finishing existing work takes priority over starting new work
The team limits work in progress to maintain flow
If a developer is blocked, they help a teammate before starting a new story
Why “Broken Build = Top Priority”
This is the single most important CI agreement. When the build is broken:
No one can integrate safely. Changes are stacking up.
Trunk is not releasable. The team has lost its safety net.
Every minute the build stays broken, the team accumulates risk.
“Fix the build” is not a suggestion. It is an agreement that the team enforces collectively. If the build is broken and someone starts a new feature instead of fixing it, the team should call that out. This is not punitive. It is the team protecting its own ability to deliver.
Stop the Line: Why All Work Stops
Some teams interpret “fix the build” as “stop merging until it is green.” That is not enough. When the build is red, all feature work stops, not just merges. Every developer on the team shifts attention to restoring green.
This sounds extreme, but the reasoning is straightforward:
Work closer to production is more valuable than work further away. A broken trunk means nothing in progress can ship. Fixing the build is the highest-leverage activity anyone on the team can do.
Continuing feature work creates a false sense of progress. Code written against a broken trunk is untested against the real baseline. It may compile, but it has not been validated. That is not progress. It is inventory.
The team mindset matters more than the individual fix. When everyone stops, the message is clear: the build belongs to the whole team, not just the person who broke it. This shared ownership is what separates teams that practice CI from teams that merely have a CI server.
Two Timelines: Stop vs. Do Not Stop
Consider two teams that encounter the same broken build at 10:00 AM.
Team A stops all feature work:
10:00 - Build breaks. The team sees the alert and stops.
10:05 - Two developers pair on the fix while a third reviews the failing test.
10:20 - Fix is pushed. Build goes green.
10:25 - The team resumes feature work. Total disruption: roughly 30 minutes.
Team B treats it as one person’s problem:
10:00 - Build breaks. The developer who caused it starts investigating alone.
10:30 - Other developers commit new changes on top of the broken trunk. Some changes conflict with the fix in progress.
11:30 - The original developer’s fix does not work because the codebase has shifted underneath them.
14:00 - After multiple failed attempts, the team reverts three commits (the original break plus two that depended on the broken state).
15:00 - Trunk is finally green. The team has lost most of the day, and three developers need to redo work. Total disruption: 5+ hours.
The team that stops immediately pays a small, predictable cost. The team that does not stop pays a large, unpredictable one.
The Revert Rule
If a broken build cannot be fixed within 10 minutes, revert the offending commit and fix the issue on a branch. This keeps trunk green and unblocks the rest of the team. The developer who made the change is not being punished. They are protecting the team’s flow.
Reverting feels uncomfortable at first. Teams worry about “losing work.” But a reverted commit is not lost. The code is still in the Git history. The developer can re-apply their change after fixing the issue. The alternative, a broken trunk for hours while someone debugs, is far more costly.
When to Forward Fix vs. Revert
Not every broken build requires a revert. If the developer who broke it can identify the cause quickly, a forward fix is faster and simpler. The key is a strict time limit:
Start a 15-minute timer the moment the build goes red.
If the developer has a fix ready and pushed within 15 minutes, ship the forward fix.
If the timer expires and the fix is not in trunk, revert immediately. No extensions, no “I’m almost done.”
The timer prevents the most common failure mode: a developer who is “five minutes away” from a fix for an hour. After 15 minutes without a fix, the probability of a quick resolution drops sharply, and the cost to the rest of the team climbs. Revert, restore green, and fix the problem offline without time pressure.
Common Objections to Stop-the-Line
Teams adopting stop-the-line discipline encounter predictable pushback. These responses can help.
Objection
Response
“We can’t afford to stop. We have a deadline.”
Stopping for 20 minutes now prevents losing half a day later. The fastest path to your deadline runs through a green build.
“Stopping kills our velocity.”
Velocity built on a broken trunk is an illusion. Those story points will come back as rework or production incidents.
“We already stop all the time. It’s not working.”
Frequent stops mean the team is merging changes that break the build too often. Fix that root cause with better pre-merge testing and smaller commits.
“It’s a known flaky test. We can ignore it.”
Ignoring a flaky test trains the team to ignore all red builds. Fix it or remove it.
“Management won’t support stopping feature work.”
Show the two-timeline comparison above. Teams that stop immediately have shorter lead times and less unplanned rework.
How Working Agreements Support the CD Migration
Each working agreement maps directly to a Phase 1 practice:
Use this template as a starting point. Customize it for your team’s context.
Team Working Agreement Template
Team Working Agreement Template
# [Team Name] Working Agreement
Date: [Date]
Participants: [All team members]
## Definition of Done
A work item is done when:
- [ ] Code is integrated to trunk
- [ ] All automated tests pass
- [ ] Code has been reviewed (method: [pair / mob / PR])
- [ ] The change is delivered to the end user (or deployable at any time)
- [ ] No known defects are introduced
-[] [Add team-specific criteria]## Definition of Ready
A work item is ready when:
- [ ] Acceptance criteria are defined (Given-When-Then)
- [ ] The item can be completed in [X] days or less
- [ ] The item is testable
- [ ] Dependencies are identified
- [ ] The team has discussed the item
-[] [Add team-specific criteria]## CI Practices- Integration frequency: at least [X] per developer per day
- Maximum branch age: [X] hours
- Review turnaround: within [X] hours
- Broken build response: fix within [X] minutes or revert
- WIP limit: [X] items per developer
## Review Practices- Default review method: [pair / mob / async PR]
- PR size limit: [X] lines
- Review focus: [correctness, security, clarity]
- Style enforcement: [automated via linting]
## Meeting Cadence- Standup: [time, frequency]
- Retrospective: [frequency]
- Working agreement review: [frequency, e.g., monthly]
## Agreement Review
This agreement is reviewed and updated [monthly / quarterly].
Any team member can propose changes at any time.
All changes require team consensus.
Tips for Creating Working Agreements
Include everyone. Every team member should participate in creating the agreement. Agreements imposed by a manager or tech lead are policies, not agreements.
Start simple. Do not try to cover every scenario. Start with the essentials (DoD, DoR, CI) and add specifics as the team identifies gaps.
Make them visible. Post the agreements where the team sees them daily: on a team wiki, in the team channel, or on a physical board.
Review regularly. Agreements should evolve as the team matures. Review them monthly. Remove agreements that are second nature. Add agreements for new challenges.
Enforce collectively. Working agreements are only effective if the team holds each other accountable. This is a team responsibility, not a manager responsibility.
Start with agreements you can keep. If the team is currently integrating once a week, do not agree to integrate three times daily. Agree to integrate daily, practice for a month, then tighten.
With working agreements in place, your team has established the foundations for continuous delivery: daily integration, reliable testing, automated builds, small work, fast review, and shared commitments.
You are ready to move to Phase 2: Pipeline, where you will build the automated path from commit to production.
Related Content
Team Burnout: Symptom that clear agreements and sustainable practices help prevent
Unbounded WIP: Anti-pattern addressed by WIP limit agreements
Undone Work: Anti-pattern prevented by a strong Definition of Done
Every artifact that defines your system (infrastructure, pipelines, configuration, database schemas, monitoring) belongs in version control and is delivered through pipelines.
Phase 1 - Foundations | Scope: Team + Org
If it is not in version control, it does not exist. If it is not delivered through a pipeline, it
is a manual step. Manual steps block continuous delivery. This page establishes the principle that
everything required to build, deploy, and operate your system is defined as code, version
controlled, reviewed, and delivered through the same automated pipelines as your application.
One process for every change
When something is defined as code:
It is version controlled. You can see who changed what, when, and why. You can revert any
change. You can trace any production state to a specific commit.
It is reviewed. Changes go through the same review process as application code. A second
pair of eyes catches mistakes before they reach production.
It is tested. Automated validation catches errors before deployment. Linting, dry-runs,
and policy checks apply to infrastructure the same way unit tests apply to application code.
It is reproducible. You can recreate any environment from scratch. Disaster recovery is
“re-run the pipeline,” not “find the person who knows how to configure the server.”
It is delivered through a pipeline. No SSH, no clicking through UIs, no manual steps. The
pipeline is the only path to production for everything, not just application code.
When something is not defined as code, it is a liability. It cannot be reviewed, tested, or
reproduced. It exists only in someone’s head, a wiki page that is already outdated, or a
configuration that was applied manually and has drifted from any documented state.
What belongs in version control
Application code
Application code in version control is the baseline. If your team is not there yet, start here before reading further.
Infrastructure
Every server, network, database instance, load balancer, DNS record, and cloud resource should be
defined in code and provisioned through automation.
What this looks like:
Cloud resources defined in Terraform, Pulumi, CloudFormation, or similar tools
Server configuration managed by Ansible, Chef, Puppet, or container images
Network topology, firewall rules, and security groups defined declaratively
Environment creation is a pipeline run, not a ticket to another team
What this replaces:
Clicking through cloud provider consoles to create resources
SSH-ing into servers to install packages or change configuration
Filing tickets for another team to provision an environment
“Snowflake” servers that were configured by hand and nobody knows how to recreate
Why it matters for CD: If creating or modifying an environment requires manual steps, your
deployment frequency is limited by the availability and speed of the person who performs those
steps. If a production server fails and you cannot recreate it from code, your mean time to
recovery is measured in hours or days instead of minutes.
Pipeline definitions
Pipeline configuration (.github/workflows/, .gitlab-ci.yml, Jenkinsfile, or equivalent) belongs in the same repository as the code it builds. When pipeline changes go through the same review and automation as application code, teams can modify their own delivery process without tickets or UI-only bottlenecks.
Database schemas and migrations
Database schema changes should be defined as versioned migration scripts, stored in version
control, and applied through the pipeline.
What this looks like:
Migration scripts in the repository (using tools like Flyway, Liquibase, Alembic, or
ActiveRecord migrations)
Every schema change is a numbered, ordered migration that can be applied and rolled back
Migrations run as part of the deployment pipeline, not as a manual step
Schema changes follow the expand-then-contract pattern: add the new column, deploy code that
uses it, then remove the old column in a later migration
What this replaces:
A DBA manually applying SQL scripts during a maintenance window
Schema changes that are “just done in production” and not tracked anywhere
Database state that has drifted from what is defined in any migration script
Why it matters for CD: Database changes are one of the most common reasons teams cannot deploy
continuously. If schema changes require manual intervention, coordinated downtime, or a separate
approval process, they become a bottleneck that forces batching. Treating schemas as code with
automated migrations removes this bottleneck.
Application configuration
Environment-specific values (connection strings, API endpoints, feature flag states, logging levels) should live in a config management system and flow through a pipeline so the same artifact is deployed to every environment. When configuration is committed and reviewed like code, you eliminate drift between environments and “works in staging” surprises. See Application Config for detailed guidance.
Monitoring, alerting, and observability
Dashboards, alert rules, SLO definitions, and logging configuration should be defined as code (Terraform, Prometheus rules, Datadog monitors-as-code, or equivalent). When you deploy frequently, you need to know instantly whether each deployment is healthy. Monitoring defined as code ensures every service has consistent, reviewed, reproducible observability instead of hand-built dashboards and undocumented alert rules.
Security policies
Security controls (access policies, network rules, secret rotation schedules, compliance
checks) should be defined as code and enforced automatically.
What this looks like:
IAM policies and RBAC rules defined in Terraform or policy-as-code tools (OPA, Sentinel)
Security scanning integrated into the pipeline (SAST, dependency scanning, container image
scanning)
Secret rotation automated and defined in code
Compliance checks that run on every commit, not once a quarter
What this replaces:
Security reviews that happen at the end of the development cycle
Access policies configured through UIs and never audited
Compliance as a manual checklist performed before each release
Why it matters for CD: Security and compliance requirements are the most common organizational
blockers for CD. When security controls are defined as code and enforced by the pipeline, you can
prove to auditors that every change passed security checks automatically. This is stronger
evidence than a manual review, and it does not slow down delivery.
The “One Change, One Process” Test
For every type of artifact in your system, ask:
If I need to change this, do I commit a code change and let the pipeline deliver it?
If the answer is yes, the artifact is managed as code. If the answer involves SSH, a UI, a
ticket to another team, or a manual step, it is not.
Security as a gate instead of a guardrail, audit failures
The goal is for every row in this table to be “yes.” You will not get there overnight, but every
artifact you move from manual to code-managed removes a bottleneck and a risk.
What Your Team Controls vs. What Requires Broader Change
Some artifact types your team can move to code-managed delivery without involving anyone
outside your boundary. Others depend on access, budget, or policy decisions beyond the team.
Your team controls directly:
Application code versioning and pipeline definitions (if they live in your repository)
Database schema migrations (once your team owns the schema)
Application configuration management and feature flag integration
Monitoring and alerting definitions for your own services
Requires broader change:
Infrastructure provisioning: If a platform team or ops team manages cloud resources, you
need their involvement to move infrastructure to code. Start by proposing to own your own
service infrastructure, or work within a self-service platform they provide.
Security policies: Defining access policies and compliance checks as code typically
requires collaboration with a security or compliance team. The goal is to automate what they
currently do manually - frame it as making their work more consistent and auditable, not
bypassing their control.
Closing manual back doors: Revoking direct production access (SSH, console access) is an
organizational policy decision. Build the case with data: show that your pipeline is reliable
enough to be the only path before asking for the access to be revoked.
Start with what you control, then make the case for organizational support using the reliability
you have already demonstrated.
How to Get There
Start with what blocks you most
Do not try to move everything to code at once. Identify the artifact type that causes the most
pain or blocks deployments most frequently:
If environment provisioning takes days, start with infrastructure as code.
If database changes are the reason you cannot deploy more than once a week, start with
schema migrations as code.
If pipeline changes require tickets to a platform team, start with pipeline as code.
If configuration drift causes production incidents, start with configuration as code.
Apply the same practices as application code
Once an artifact is defined as code, treat it with the same rigor as application code:
Store it in version control (ideally in the same repository as the application it supports)
Review changes before they are applied
Test changes automatically (linting, dry-runs, policy checks)
Deliver changes through a pipeline
Never modify the artifact outside of this process
Eliminate manual pathways
The hardest part is closing the manual back doors. As long as someone can SSH into a server and
make a change, or click through a UI to modify infrastructure, the code-defined state will drift
from reality.
The principle is the same as Single Path to Production
for application code: the pipeline is the only way any change reaches production. This applies to
infrastructure, configuration, schemas, monitoring, and policies just as much as it applies to
application code.
Measuring Progress
Metric
What to look for
Artifact types managed as code
Count of categories fully code-managed; should increase over time
Manual changes to production
Changes made outside a pipeline (SSH, UI, manual scripts); target zero